
Fair Value Gap
A fair value gap is a retail chart-reading term for a space between the high of one candle and the low of the candle two bars later, left by a fast middle candle.
A fair value gap (FVG) is a space on a chart between the high of one candle and the low of the candle two bars later, left by a fast candle in between. It is a term from the informal smart money concepts vocabulary used by retail traders.
The term has no official definition from any exchange or platform vendor, so this page uses the common three-candle convention.
How is a fair value gap drawn?
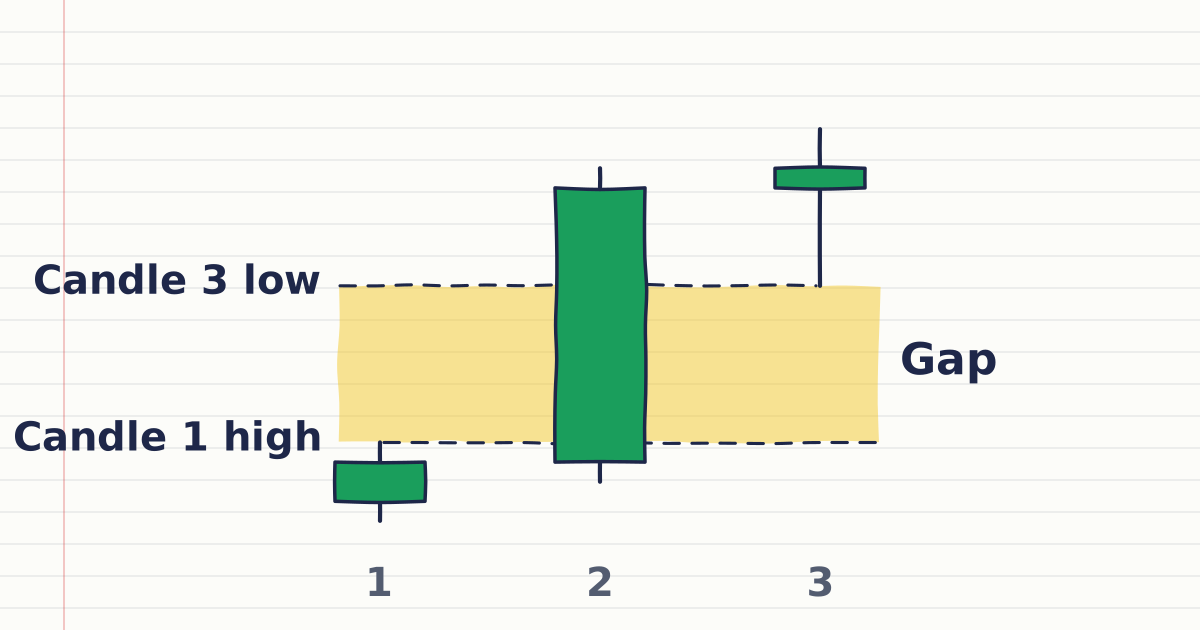
A fair value gap is drawn across three candles: mark the price range between candle 1's high and candle 3's low that only candle 2 traded through. That is a bullish gap; a bearish gap runs from candle 1's low to candle 3's high. Each candle shows an open, high, low and close for its period.
The usual convention looks at three consecutive candles:
- Bullish gap: the low of candle 3 is above the high of candle 1. The space between those two prices is the gap. Candle 2 is a fast, large move up.
- Bearish gap: the high of candle 3 is below the low of candle 1. Candle 2 is a fast, large move down.
Candle 2's own range overlaps both neighbours. The gap is only the part of the price range that candles 1 and 3 never traded in.
Worked example. On a USDZAR chart, candle 1 has a high of 18.2000. Candle 2 runs from 18.1900 to 18.2700. Candle 3 has a low of 18.2400. Candles 1 and 3 never traded between 18.2000 and 18.2400, so a bullish gap is marked there. Its width is 18.2400 − 18.2000 = 0.0400, or 400 pips. Traders who use the term then watch whether later candles trade back into 18.2000–18.2400.
How does it show in MetaTrader 5?
MetaTrader 5 has no fair value gap indicator, so traders mark the zone by hand with a Rectangle between the two outer candles. Charts can be shown as bars, Japanese candlesticks or a line, so on a candlestick chart you see three candles with a space between two of them.
The Rectangle from the Shapes items needs two points: one at candle 1's edge of the gap and one at candle 3's.
Is it the same as a price gap?
No: a price gap is a jump between one candle's close and the next candle's open, while a fair value gap spans three candles. Price gaps often follow a weekend or news (see trending and ranging markets). A fair value gap can appear with no jump between any two neighbouring candles.
How weekend and news gaps form is covered in news gaps and slippage.
Does the name mean price is "unfair" there?
No: "fair value" is only a label for an area where price moved quickly, not a measure of what the instrument is worth. The definition records where price moved fast. Whether price later returns to the zone is something traders watch on the chart; it is not part of the definition.
How does a fair value gap relate to order blocks?
A fair value gap is one of the smart money concepts labels, usually read alongside the order block and the liquidity sweep on the same chart. All three describe what a chart has already done. Traders size any position from its stop distance first, for example with the position size calculator.
Sources
- MetaQuotes, MqlRates, MQL5 Reference, accessed 19 October 2026: each bar record holds the period's open, high, low and close prices. https://www.mql5.com/en/docs/constants/structures/mqlrates
- MetaQuotes, View and Configure Charts, MetaTrader 5 Help, accessed 19 October 2026: charts can be shown as bars, Japanese candlesticks or a broken line. https://www.metatrader5.com/en/terminal/help/charts_analysis/charts
- MetaQuotes, Shapes, MetaTrader 5 Help, accessed 19 October 2026: the Rectangle is added from the Insert menu or Line Studies toolbar and needs two points. https://www.metatrader5.com/en/terminal/help/objects/shapes
Practise what you learned
Open an account to use MetaTrader 5. Start on a demo account before risking real money.
Open Account