
Market Structure in Forex: How to Read Trends and Ranges
Market structure in forex is the pattern of swing highs and lows: higher highs and lows mean an uptrend, lower ones a downtrend, and flat ones a range. Traders read it on one timeframe to judge direction before planning a trade.
Module 4 · Lesson 3 of 5
What you'll learn
- What market structure means on a forex chart.
- What swing highs and swing lows are, and how to mark them.
- How to tell an uptrend, a downtrend and a range apart.
- What it looks like when a trend ends or a range breaks, and what break of structure means.
- Why the answer depends on the timeframe.
What is market structure in forex?
Market structure in forex is the pattern a currency pair's swing highs and swing lows make on a chart. Higher highs and higher lows form an uptrend, lower highs and lower lows form a downtrend, and roughly level highs and lows form a range. Traders read it on one timeframe at a time to judge direction before planning a trade.
Market structure is read from price alone, so the same method works on any pair, any instrument and any timeframe. The phrase is sometimes also used for how the forex market itself is organised, between banks, brokers and liquidity providers; that meaning is covered in brokers and liquidity providers. This lesson is about the chart.
What is a trend in trading?
A trend in trading is a sustained move in one direction, where price keeps making higher highs and higher lows in an uptrend, or lower highs and lower lows in a downtrend. It lasts until that sequence breaks. A trend can run for hours on M15 or for months on D1, so always name the timeframe.
An uptrend is also called a bullish trend and a downtrend a bearish trend. A market with no clear sequence is not trending: it is ranging, and the next section shows how to tell the two apart. The words are explained in bullish vs bearish.
How do trending and ranging markets differ?
A trending market moves in one direction, with each swing high and swing low beyond the last, while a ranging market moves sideways between roughly flat highs and lows. You tell them apart by the turning points, not by a feeling. Higher highs and higher lows mean an uptrend; lower highs and lower lows mean a downtrend.
| Uptrend | Downtrend | Range | |
|---|---|---|---|
| Swing highs | Each higher than the last | Each lower than the last | Roughly level |
| Swing lows | Each higher than the last | Each lower than the last | Roughly level |
| What the chart looks like | A zigzag stepping up | A zigzag stepping down | A zigzag between a ceiling and a floor |
| What breaks it | A lower low | A higher high | A clear move past the ceiling or floor |
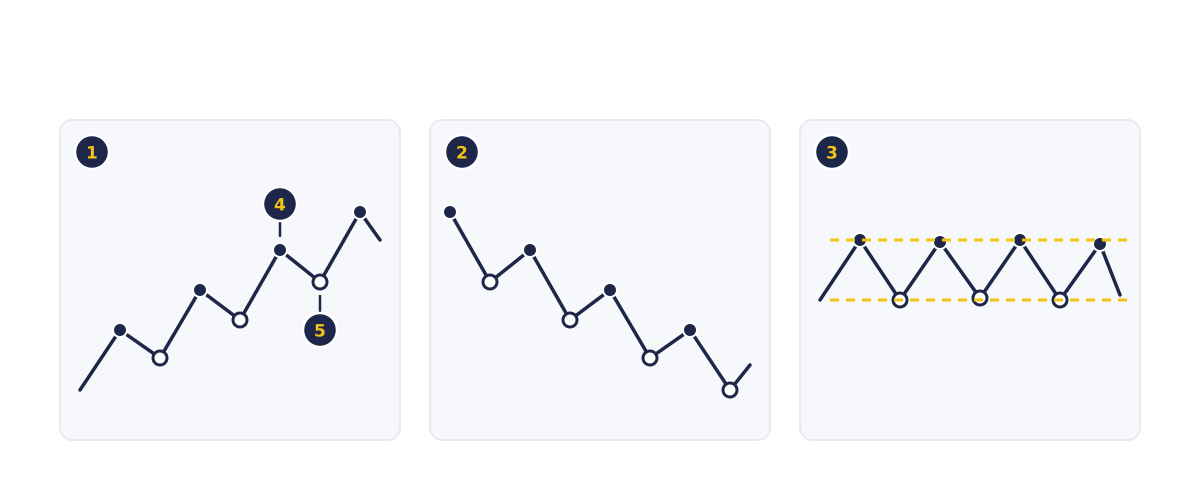
- Uptrend: each peak and each dip is higher than the last.
- Downtrend: each peak and each dip is lower than the last.
- Range: peaks and dips are roughly level, between two dashed lines.
- Filled circles mark swing highs; hollow circles mark swing lows.
What are swing highs and swing lows?
A swing high is a peak: a candle whose high is above the highs of the candles on either side. A swing low is a trough: a candle whose low is below the lows on either side. Every trend and range is built from these turning points.
- Higher high or lower high: a swing high above, or below, the previous swing high.
- Higher low or lower low: a swing low above, or below, the previous swing low.
Two candles on each side is a common convention for how many must sit either side. Whatever rule you choose, use it every time. For a refresher on a candle's high and low, see candlestick anatomy.
How do you mark swing highs and lows on a chart?
You mark swings by scanning the chart from left to right, labelling each clear peak a swing high and each clear trough a swing low, then comparing each with the previous swing of the same kind. It takes a few minutes and works the same way on any instrument and any timeframe you choose.
- Pick one timeframe and stay on it, for example H4.
- From the left, mark the first clear peak with lower highs on each side as a swing high.
- Mark the next clear trough with higher lows on each side as a swing low.
- Continue right, alternating. Ignore wiggles that fail your rule.
- Label each swing higher or lower than the previous one of its kind.
- Leave the newest candles unmarked. A peak forming now is not a swing high until candles form on its right.
How do you identify an uptrend or a downtrend?
An uptrend shows at least two higher highs and two higher lows in a row; a downtrend shows lower highs and lower lows. A higher high followed by a lower low is not a clean uptrend. It is a market swinging wider in both directions, so label it unclear rather than forcing a trend.
A synthetic EURUSD sequence of swing points, in order:
| Swing | Price | Compared with the last of its kind |
|---|---|---|
| 1. Low | 1.0800 | Start |
| 2. High | 1.0850 | Start |
| 3. Low | 1.0830 | Higher low |
| 4. High | 1.0880 | Higher high |
| 5. Low | 1.0855 | Higher low |
| 6. High | 1.0905 | Higher high |
| 7. Low | 1.0840 | Lower low |
| 8. High | 1.0890 | Lower high |
By swing 6, three rising lows and three rising highs make an uptrend by definition. A dip that holds above the previous swing low, such as swing 5, is a pullback: a pause inside the trend, not a range. Swings 7 and 8 are explained below. A downtrend reads the same way in reverse.
How do you identify a range?
A range shows swing highs stopping near one price and swing lows stopping near another, so the chart moves sideways between a ceiling and a floor without new highs or new lows. The levels do not need to match to the pip. Roughly level is enough, as long as neither side is clearly rising or falling.
Synthetic example: EURUSD makes swing highs at 1.0860, 1.0858 and 1.0861, and swing lows at 1.0820, 1.0822 and 1.0819. It is ranging between about 1.0820 and 1.0860.
From edge to edge is 1.0860 − 1.0820 = 0.0040, or 40 pips. For 0.10 lot of EURUSD in a US dollar account, one pip is worth $1, so 40 pips is $40. Lot sizes are explained in our guide to forex lot sizes, and the pip value calculator works out other sizes.
What does it look like when a trend ends or a range breaks?
An uptrend's structure ends when price makes a lower low and then a lower high; a downtrend's ends with a higher high and a higher low. A range breaks when price moves clearly beyond its ceiling or floor. These swings are the first objective sign that the old structure no longer holds, so traders watch for them closely.
In the example above, swing 7 falls to 1.0840, below the previous low of 1.0855. At swing 8, the next rally stops at 1.0890, below 1.0905. The chart now shows a lower high and a lower low, so the uptrend structure has ended.
From here, price can build a downtrend, settle into a range or push to new highs, and the next swings show which. A range can also break and then return inside, often called a false break, which is why traders look for a clear move past the edge.
What do break of structure and change of character mean?
Break of structure (BOS) and change of character (CHoCH) are informal labels many traders use for the swing events in this lesson: a BOS is a new swing beyond the last one in the trend's direction, and a CHoCH is the first swing that breaks against it. Usage varies slightly between sources, so check how each source defines them.
In the EURUSD example above:
| Swing | What happened | Informal label |
|---|---|---|
| 6. High at 1.0905 | Above the previous high of 1.0880, in the uptrend's direction | Break of structure (BOS) |
| 7. Low at 1.0840 | Below the previous low of 1.0855, against the uptrend | Change of character (CHoCH) |
| 8. High at 1.0890 | Below the previous high of 1.0905 | Uptrend structure has ended |
Traders use a BOS to confirm a trend is still extending, and a CHoCH as the first sign that it may be turning.
What are order blocks and fair value gaps?
Order blocks and fair value gaps are informal labels some traders mark around a sharp price move. An order block is the last candle that moved the other way before the move; a fair value gap is a space the candles either side of a fast candle never traded in.
Traders mark both as zones where price may react if it returns, a method set out in the supply and demand zones guide. Each comes in a bullish version, tied to a sharp rise, and a bearish version, tied to a sharp fall. Here bullish and bearish name the direction of that move.
Traders draw them slightly differently, and MetaTrader 5 has no built-in indicator for them, so they are marked by hand, usually with a Rectangle from the Shapes items. When price returns to a zone, it can react, trade straight through it, or never come back, and the next candles show which.
Why does the answer depend on the timeframe?
Whether a market is trending or ranging depends on the timeframe, because each timeframe groups price into candles of a different length and so shows different swings. EURUSD can step higher on the H4 chart for weeks while moving sideways within a single day on M15. Both readings can be correct at once.
MetaTrader 5 offers 21 chart timeframes, from one minute to one month, and its help notes that higher timeframes are used to analyse longer-term trends. So always name the timeframe, for example "an uptrend on H4". Timeframes are covered in chart timeframes.
Why do chart tools behave differently in trends and ranges?
The same chart tool behaves differently in a trend and a range because price behaves differently: in a range it keeps returning to the same levels, while in a trend it keeps leaving old levels behind. Knowing the structure helps you read any tool.
- Horizontal lines. In MetaTrader 5, a horizontal line can mark support and resistance levels. In a range, price has touched the ceiling and floor lines several times; in a trend, it passes old lines and moves away. See support and resistance.
- Trend lines. A line through rising swing lows follows an uptrend; in a range it would be flat. Trend lines are covered in Module 6.
- Moving averages. In a trend, price stays mostly on one side; in a range, it crosses back and forth, and crossover signals such as the golden cross flip back and forth too.
What mistakes do traders make reading trends and ranges?
Four mistakes spoil a structure reading: assuming a trend must continue, marking swings inconsistently, mixing timeframes and labelling a chart before enough swings exist. A correct reading gives a plan its direction. The stop loss and position size set what the trade can lose, including when price gaps after news or a weekend.
- Assuming a trend must continue. Structure only describes the swings so far; the next swing shows whether it still holds.
- Inconsistent marking. Counting small wiggles in one place but not another creates false trends.
- Mixing timeframes. Calling an uptrend on H4, then judging it on M5 swings, gives conflicting answers.
- Too few swings. One higher high is not a trend. Label those charts unclear and move on.
Position sizing and stop placement are covered in Module 5, Risk Management.
Try it on demo
In MetaTrader 5, open H4 charts for three instruments, such as EURUSD, GBPUSD and gold. Mark the swings, label each chart uptrend, downtrend, range or unclear, and note the swing that decided it. Add horizontal lines at any range's edges from the Insert menu or the Line Studies toolbar, then check again in a few days to see whether the structure changed.
This lesson is part of Reading Price Charts. Next, learn how price levels form in support and resistance.
Quick check
- An uptrend is defined by
- A swing low is
- Swing highs at 1.0860 and 1.0858 and swing lows at 1.0820 and 1.0822 describe
- An uptrend makes a swing low below its previous swing low. This means
- The same EURUSD chart is in an uptrend on H4 and a range on M15. Which is correct?
Frequently asked questions
What is a higher high and a higher low in market structure?
A higher high is a swing high above the previous swing high, and a higher low is a swing low above the previous swing low. Together, they define an uptrend's market structure.
Can a market be trending and ranging at the same time?
Yes, on different timeframes. EURUSD can be in an uptrend on H4 while moving sideways on M15, because each timeframe shows different swings.
How long does a trend last?
A trend lasts until its swing structure breaks, which can take a few candles or many months. In an uptrend, watch the swing lows: a lower low is the first objective sign that it has ended.
Is it better to trade in a trending or a ranging market?
Both can be traded, with different approaches. In a trend, traders usually trade in the trend's direction, often on pullbacks, whose depth they can measure with Fibonacci retracement levels; in a range, they work the edges where price has turned before. Either way, the stop loss and position size set what each trade can lose, covered in Module 5, Risk Management.
Which indicator shows if a market is trending or ranging?
The Average Directional Movement Index (ADX) is built for the question: MetaTrader 5's help says it helps to determine if there is a price trend. Use it alongside the swings you marked.
Sources
- MetaQuotes, View and Configure Charts, MetaTrader 5 Help (accessed 27 October 2026): 21 chart timeframes from one minute to one month, and higher timeframes used to analyse longer-term trends. https://www.metatrader5.com/en/terminal/help/charts_analysis/charts
- MetaQuotes, Lines, MetaTrader 5 Help (accessed 27 October 2026): a horizontal line can mark support and resistance levels; a trendline is drawn through two points. https://www.metatrader5.com/en/terminal/help/objects/lines
- MetaQuotes, Analytical Objects, MetaTrader 5 Help (accessed 27 October 2026): objects are added from the Insert menu or the Line Studies toolbar and are plotted manually. https://www.metatrader5.com/en/terminal/help/charts_analysis/objects
- MetaQuotes, Average Directional Movement Index, MetaTrader 5 Help (accessed 27 October 2026): ADX helps to determine if there is a price trend. https://www.metatrader5.com/en/terminal/help/indicators/trend_indicators/admi
Practise what you learned
Open an account to use MetaTrader 5. Start on a demo account before risking real money.
Open Account