
Swing High
A swing high is a peak on a price chart, a candle whose high is above the highs of the candles on either side of it; a swing low is the matching trough.
A swing high is a peak on a price chart: a candle whose high is above the highs of the candles on either side of it. The matching trough is a swing low, a candle whose low is below the lows on either side.
Swings are the turning points that trends, ranges and most chart patterns are built from. Traders commonly mark one with two candles on each side.
Why do swing highs matter?
Swing highs matter because comparing each one with the previous swing high, and each swing low with the previous low, tells you whether the market is trending up, trending down or ranging. The table shows how each sequence of swings is usually named.
Comparing each swing with the previous one of the same kind describes the market's structure, as explained in trends and ranges:
| Sequence | Common name |
|---|---|
| Higher highs and higher lows | Uptrend |
| Lower highs and lower lows | Downtrend |
| Highs and lows at similar levels | Range |
Swing highs are also where resistance levels are usually drawn, as in support and resistance, and where informal labels such as break of structure come from.
Worked example: swing high on EURUSD
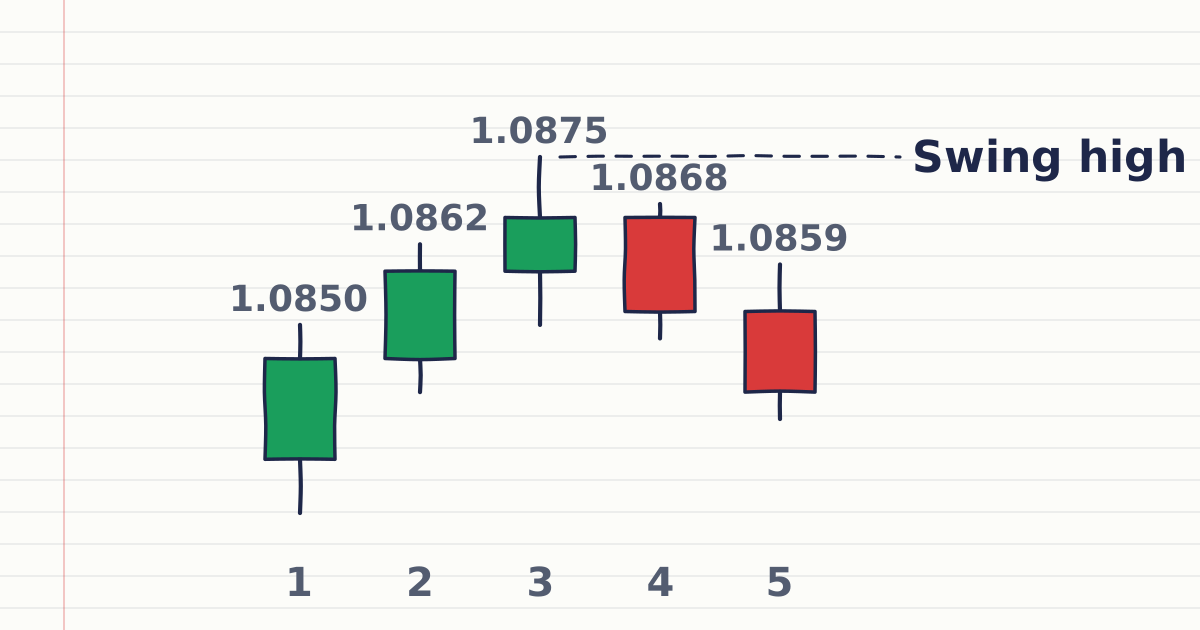
Five consecutive H1 candles have these highs:
| Candle | High |
|---|---|
| 1 | 1.0850 |
| 2 | 1.0862 |
| 3 | 1.0875 |
| 4 | 1.0868 |
| 5 | 1.0859 |
Candle 3's high, 1.0875, is above the two highs before it and the two after it, so with a two-candle rule it is a swing high. Until candles 4 and 5 had closed, it was only a possible swing high: if candle 4 had reached 1.0880, candle 3 would not have counted. That is why the newest candles on a chart are left unmarked.
How do traders mark swings consistently?
Traders mark swings consistently by using one fixed candle rule, working on the timeframe they trade, and marking only swings whose later candles have closed. Two candles on each side is the common default rule. The three habits are explained below.
- One rule. A one-candle rule marks many more swings than a three-candle rule; two on each side is the common default.
- The right timeframe. Mark swings on the timeframe you trade and check the higher one: a swing high on M15 can be invisible on D1.
- Closed candles only. A swing high is confirmed once the later candles have closed, so leave the newest candles unmarked.
How do you mark a swing high in MetaTrader 5?
MetaTrader 5 does not mark swings automatically in its standard indicators, so you mark each swing high yourself with a horizontal line. Use horizontal lines or other analytical objects, read exact highs in the Data Window, and apply the same rule on every swing.
What do traders often get wrong about swing highs?
The common mistake is treating a swing high as a ceiling, when it only marks where price turned down once. Traders watch what happens when price returns: a close above it breaks the structure, and a rejection there turns it into resistance.
Sources
- MetaQuotes, MetaTrader 5 Help: Lines, accessed 19 October 2026: a horizontal line marks price levels such as support and resistance; a trendline is drawn through two points. https://www.metatrader5.com/en/terminal/help/objects/lines
- MetaQuotes, MetaTrader 5 Help: View and Configure Charts, accessed 19 October 2026: chart timeframes from one minute to one month, with higher timeframes used to analyse longer-term trends. https://www.metatrader5.com/en/terminal/help/charts_analysis/charts
Practise what you learned
Open an account to use MetaTrader 5. Start on a demo account before risking real money.
Open Account