
Support and Resistance: What They Are and How to Draw Them
Support and resistance are price areas where a market has repeatedly stopped falling (support) or stopped rising (resistance). Traders draw them as zones rather than exact lines and use them to plan entries, stops and targets.
Module 4 · Lesson 4 of 5
What you'll learn
- What support and resistance are, and why they form on a chart.
- Why a level is a zone, not one exact price.
- How to draw support and resistance in MetaTrader 5, step by step.
- What role reversal is, and the limits of every level.
What are support and resistance?
Support is a price area below the current price where falls have repeatedly stopped, and resistance is a price area above it where rises have repeatedly stopped. They mark places where buying outweighed selling (support) or selling outweighed buying (resistance), and traders use them to plan entries, stops and targets.
This lesson is part of the Reading Price Charts module. If wicks and highs are new to you, start with the candlestick anatomy lesson.
Definitions
- Support: an area below price where falling prices have stopped and turned up more than once.
- Resistance: an area above price where rising prices have stopped and turned down more than once.
- Touch: a time price reached the area and turned away from it.
Why do support and resistance levels form?
Support and resistance form where many traders made the same decision at a similar price, so buying or selling briefly outweighed the other side. When price returns to that area, some traders remember it and act again. That shared memory is why one area can stop price repeatedly, and why levels many traders can see draw the most attention.
Common places to look:
- Previous highs and lows, where rises or falls stopped before.
- Round numbers, such as 1.1000 on EURUSD, which many traders watch.
- The edges of a range. When price moves sideways, its top and bottom act as resistance and support, as the trends and ranges lesson shows.
- Sloping lines. Not every level is flat. A rising or falling trend line can also act as support or resistance. Trend lines are covered later in Module 6.
What is the difference between support and resistance?
The difference is position and direction: support sits below the current price and has stopped falls, while resistance sits above it and has stopped rises. The same area can be either, depending on where price is now. That is why a level can change role after price moves through it.
| Support | Resistance | |
|---|---|---|
| Where it sits | Below the current price | Above the current price |
| What it did before | Stopped falls | Stopped rises |
| Side that outweighed the other | Buying | Selling |
| Drawn from | Swing lows | Swing highs |
| After a clear break | Can act as resistance | Can act as support |
Why are support and resistance zones, not exact lines?
Support and resistance are zones because price rarely turns at the exact same price twice. One touch may stop at 1.0800, the next at 1.0806, and a wick may poke a few pips past. A narrow band around the touches describes what happened more accurately than one perfect line, and it stops you treating a small overshoot as a break.
To size a zone, run it from the lowest touch to the highest touch of the same area. If the band is wide compared with normal candles, it may not be a clear level at all. Traders who mark zones where price left sharply and then plan trades on the return use supply and demand zones.
How do you draw support and resistance in MetaTrader 5?
In MetaTrader 5, you draw support and resistance with the Horizontal Line object for a single level or the Rectangle object for a zone, both found under the Insert menu or on the Line Studies toolbar. The MetaTrader 5 help on lines notes that a horizontal line can mark support and resistance levels.
- Open a chart. A higher timeframe, such as H4 or D1, gives a cleaner view.
- Find two or more places where price turned at a similar price, looking at both the wicks and the candle closes.
- For a single level, pick Horizontal Line from the lines group in the Insert menu or the Line Studies toolbar, and click once on the chart at that price. The line has one setting, its price, which you can type in the Value field of its properties.
- For a zone, choose the Rectangle from the shapes group, click at one corner and drag across the touches to the opposite price. The MetaTrader 5 help on the rectangle shows how to set each corner's date and price and turn the fill on or off.
- Remove lines you no longer need. The help on analytical objects explains that objects are drawn by hand and can be deleted from the right-click menu.
Keep two or three levels near the current price. A chart covered in lines hides the levels that matter.
What is role reversal in support and resistance?
Role reversal is when a broken level swaps jobs: old resistance starts acting as support, or old support starts acting as resistance. After price closes clearly through a level, it sometimes returns to test it from the other side. That return is often called a retest, and the candles there show whether the level has switched roles.
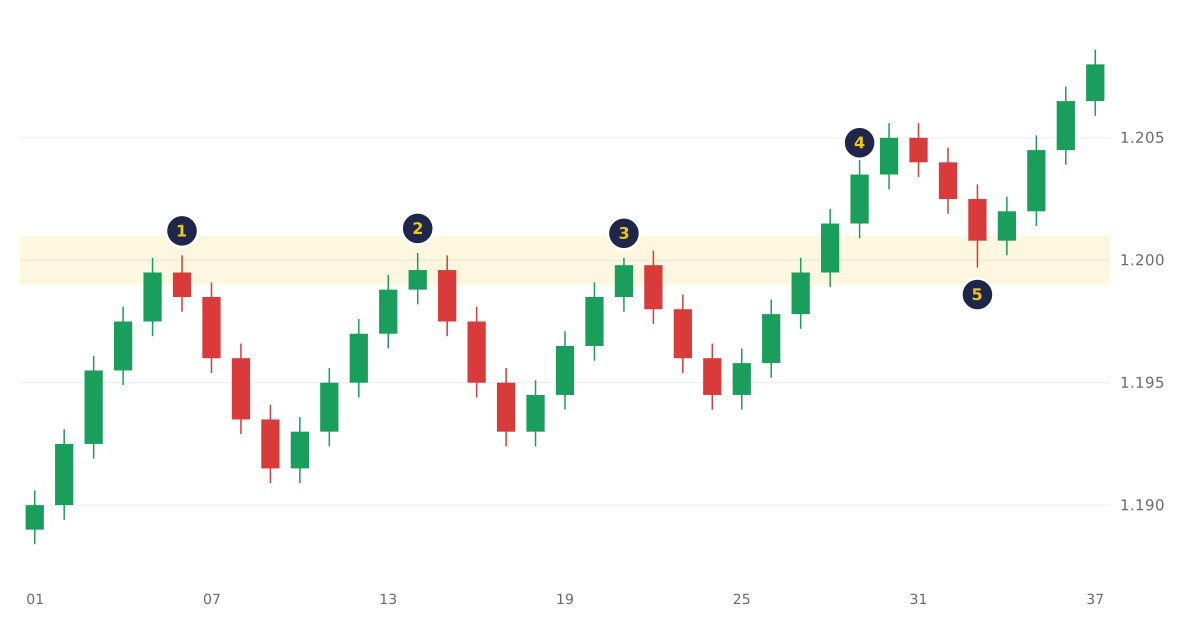
- Points 1, 2 and 3: price rises into the shaded zone between 1.1990 and 1.2010 and turns lower each time.
- Point 4: price closes above the zone and keeps rising.
- Point 5: price falls back into the zone and turns up, so the old resistance acts as support.
- Had price closed back below the zone at point 5, the retest would have failed and the level would not have switched roles.
How breakouts and false breakouts behave is covered later in Module 6, in the lesson on breakouts. When a candle closes beyond the last swing high or low in the direction of the trend, traders call it a break of structure (BOS).
What makes a support or resistance level more noticeable?
A level is more noticeable when price has turned there several times, on a higher timeframe, with clear reactions. Noticeable means more traders are likely to see it and act around it. Use the factors below to rank the levels on your chart and keep the clearest ones.
| Factor | Less noticeable | More noticeable |
|---|---|---|
| Touches | One | Two or more |
| Timeframe | M5 or M15 | H4, D1 or W1 |
| Reaction | Small drift away | Clear turn of many pips |
| Price | An odd number | A round number or an old high or low |
Different timeframes show different levels, as the chart timeframes lesson explains.
How do you calculate the money between a price and a level?
To calculate the money between a price and a level, count the pips between them, then multiply by the pip value of your position size. It is the same sum used to measure the risk of any stop loss placed near a level.
Worked example
EURUSD has turned up from a support zone between 1.0800 and 1.0810 three times. Someone holds a buy at 1.0830 with a stop loss 10 pips below the zone, at 1.0790. For 0.10 lot of EURUSD, one pip is worth about $1.
| Step | Calculation | Result |
|---|---|---|
| Distance to the stop | 1.0830 − 1.0790 | 0.0040 = 40 pips |
| Pip value at 0.10 lot | About $1 per pip | $1 |
| Money at risk if the stop fills at its price | 40 pips × $1 | $40 |
The pip value calculator works out pip values for other pairs and sizes, and the stop loss and take profit lesson explains how a stop is triggered.
The spread, and any slippage if price jumps past the stop, are added to that figure.
How do skilled traders handle a level that breaks?
Skilled traders plan every trade at a level with a stop beyond the zone, so a break costs a known, planned amount. Levels break, especially around major news or when a market reopens after the weekend. A level is a place to plan around, and the stop is what turns a break into a small, planned loss.
- Levels break. A level that held three times can give way on the fourth; the stop beyond the zone handles that.
- Price can gap past a level, and past a stop near it, so the stop can fill at a worse price.
- Lines are subjective. Two people can draw the same chart differently; drawing zones from clear touches keeps yours consistent.
- Add context. A level shows where price reacted before; the trend and the candles at the level complete the picture, which is how candlestick patterns are read at a level. Planning risk is covered in Module 5, Risk Management.
What is a liquidity sweep?
A liquidity sweep is an informal name for price moving briefly beyond an obvious high or low, then returning back inside the earlier range. The idea is that many traders place stop orders just beyond a visible level, so a move into that area can trigger them together, and each triggered stop becomes a market order. Those orders are not visible on the chart, so a move is only called a sweep once price has come back inside. The practical point is for stop placement: a stop just past an obvious level can be filled during a brief spike, sometimes at a worse price than the stop.
Try it on demo
On a demo account in MetaTrader 5, open a D1 chart of EURUSD or XAUUSD. Mark at most two zones with the Rectangle object where price has turned at least twice. Over the next weeks, note whether price reacts, passes through, or breaks and retests. To choose other pairs to practise on, best forex pairs to trade compares eight widely traded pairs.
Quick check
- Support is a price area where
- Why is a level better drawn as a zone than as one exact price?
- Role reversal means
- A buy at 1.0830 has a stop at 1.0790. At 0.10 lot ($1 per pip), how much is at risk if the stop fills at its price?
- Which MetaTrader 5 object draws a support or resistance zone?
Frequently asked questions
Is support and resistance reliable?
It is a core chart-reading tool because it shows where price has actually turned before. Traders make it more useful by combining it with the trend and placing the stop beyond the zone, so a break costs a planned amount.
How many touches make a valid support or resistance level?
There is no official number, but many chart readers wait for at least two clear touches. One touch can be chance. More touches make a level easier for other traders to see.
Which timeframe is best for support and resistance?
Start on higher timeframes such as H4 and D1. Their levels are seen by more traders and the chart is less cluttered, so many traders mark levels there first.
What happens when support breaks?
Price moves below the zone, and the old support may later act as resistance if price comes back up to it. This is role reversal, and the retest shows whether the level has switched roles.
Should you draw support and resistance on wicks or candle bodies?
Use both. Wicks show how far price reached, and bodies show where it closed. A zone that runs from the closes to the wick tips covers both and avoids arguing over one exact price.
Sources
- MetaQuotes, MetaTrader 5 Help: Lines, accessed 19 October 2026: the horizontal line can be used to mark various levels, particularly support and resistance, and one point sets it. https://www.metatrader5.com/en/terminal/help/objects/lines
- MetaQuotes, MetaTrader 5 Help: Rectangle, accessed 19 October 2026: a rectangle is drawn by setting an initial point and dragging to size, with date and price for each corner and a fill on or off setting. https://www.metatrader5.com/en/terminal/help/objects/shapes/rectangle
- MetaQuotes, MetaTrader 5 Help: Analytical Objects, accessed 19 October 2026: objects are added from the Insert menu or the Line Studies toolbar, are plotted manually, and can be removed using the context menu. https://www.metatrader5.com/en/terminal/help/charts_analysis/objects
Practise what you learned
Open an account to use MetaTrader 5. Start on a demo account before risking real money.
Open Account