
Candlestick Patterns: How to Read and Trade Them
Candlestick patterns are named shapes made by one to three candles, such as the hammer, doji and engulfing candle, that show how buying and selling played out. Read them at a level after a clear move, once the candle closes, and set entry, stop loss and take profit from the pattern’s high and low.
Candlestick patterns are named shapes formed by one, two or three candles on a price chart, such as the hammer, the doji and the engulfing candle. Each one shows how buying and selling played out over a few recent periods.
Read in context, at a level that has turned price before and after a clear move, a pattern gives you three things a trade plan needs: a reason to act, a price to enter at and a price where the idea is wrong.
This guide is a pattern library and a how-to. It assumes you can already read a single candle's body, wicks, open, high, low and close, which the candlestick chart lesson explains.
What are candlestick patterns?
A candlestick pattern is a recognisable arrangement of one or more candles that chart readers give a name to. Each candle summarises one period on your chosen timeframe. A pattern compares the size of the body, the length of the wicks and the position of the close with the candles around it.
The names come from Japanese rice-market charting, which Western traders adopted much later. They are conventions rather than platform rules, so two sources can describe the same pattern with slightly different thresholds. Wikipedia's article on candlestick patterns counts 42 recognised patterns, and other references list more. Most traders work with a short list of common ones and learn those well.
What are the main types of candlestick patterns?
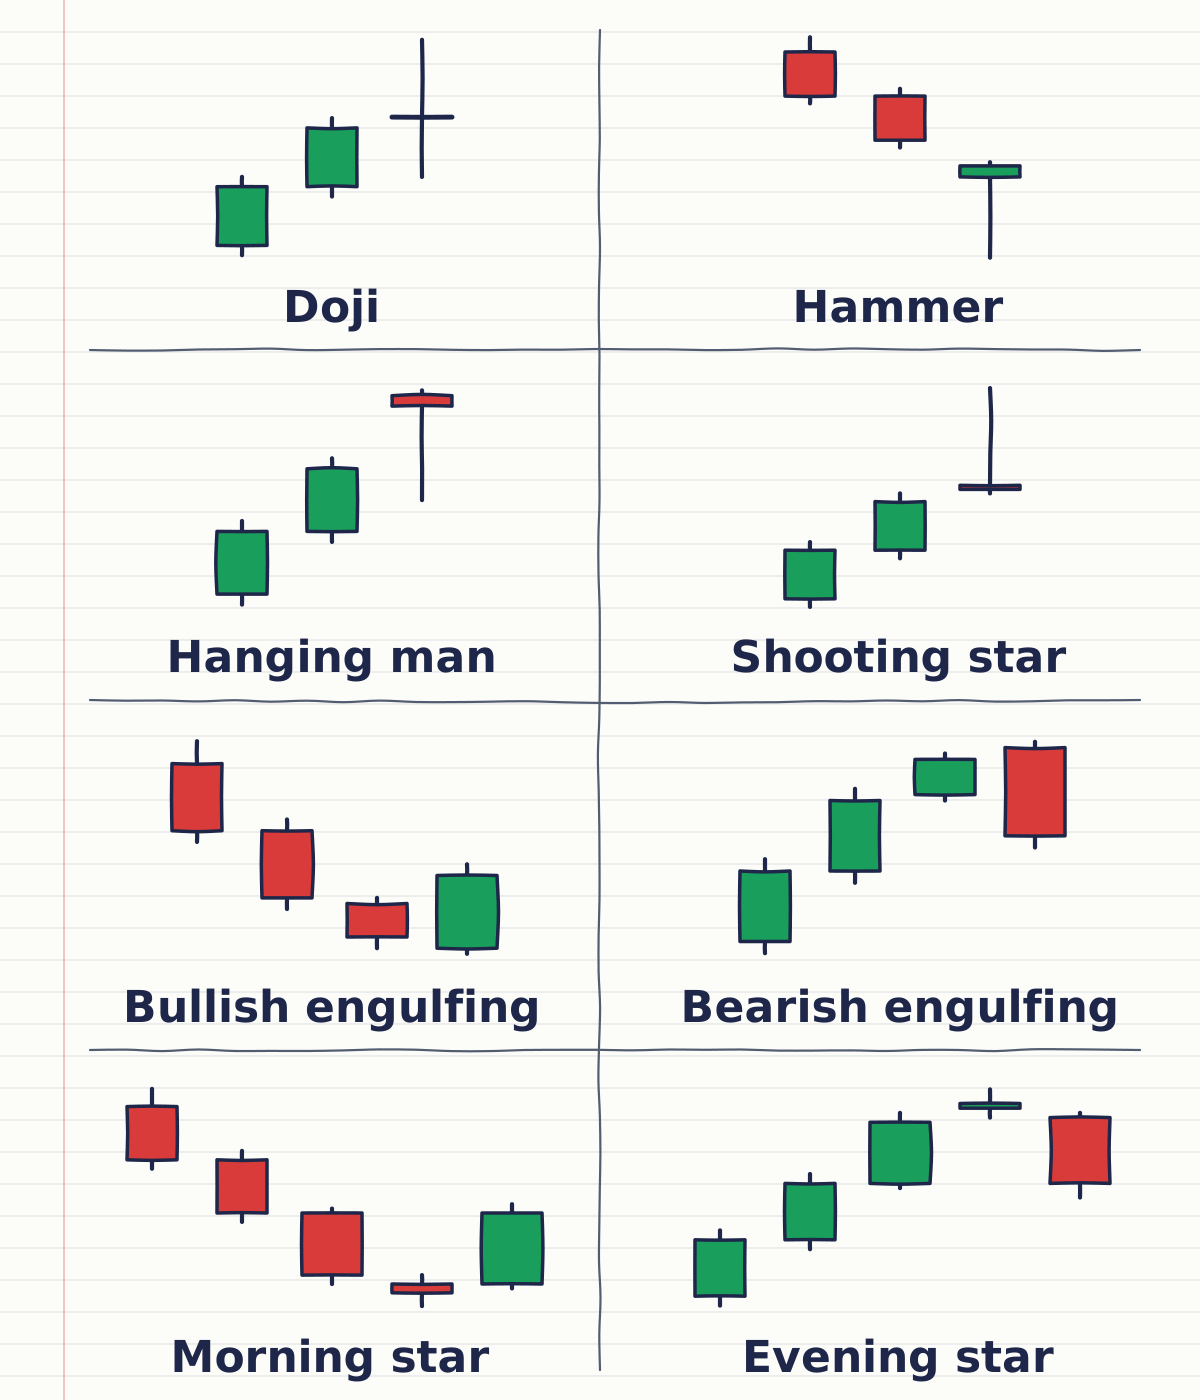
Candlestick patterns are usually grouped by how many candles they contain: single-candle, two-candle and three-candle patterns. Each group also splits into bullish shapes (seen after a fall) and bearish shapes (seen after a rise). "Bullish" and "bearish" describe the move that came before and the reading a trader puts on it, as covered in bullish vs bearish.
| Pattern | Candles | What it looks like | Usual context |
|---|---|---|---|
| Doji | 1 | Open and close at or near the same price, so almost no body | Anywhere; read as a pause |
| Hammer | 1 | Small body near the top, long lower wick | After a decline |
| Shooting star | 1 | Small body near the bottom, long upper wick | After a rise |
| Pin bar | 1 | One long wick, small body at the other end | The general long-wick shape, any direction |
| Engulfing candle | 2 | Second body fully covers the first body, in the opposite direction | After a move in the first candle's direction |
| Morning star | 3 | Long bearish candle, small-bodied candle, long bullish candle closing into the first body | After a decline; its mirror is the evening star |
Each glossary entry gives the exact shape, the look-alikes and an example. "Long" and "small" are always judged against nearby candles, not a fixed number of pips.
How do you read a candlestick pattern?
Read a pattern in context: what came before it, where it formed, and on which timeframe. A hammer after a long fall into an old low tells you far more than the same hammer in the middle of a quiet range. Work through the same five checks every time.
- Wait for the candle to close. Until a period ends, its body, wicks and colour can still change. The pattern exists once the candle closes.
- Check the move before it. A hammer comes after a decline. The same shape after a rise is called a hanging man. Trends and ranges explains how to describe the move.
- Check where it formed. The strongest readings come at a price area that has stopped the market before. See support and resistance.
- Check the timeframe. One H4 candle contains four H1 candles, and patterns on H4 and daily charts summarise more trading than those on M5. Chart timeframes covers how the view changes.
- Name the level that proves the reading wrong. For a hammer, that is a close below its low; for a shooting star, a close above its high. That level is where your stop loss goes.
How do you trade a candlestick pattern?
Trade a pattern with three prices set from the pattern itself: an entry just beyond its high or low, a stop loss just beyond its other end, and a take profit at the next level. Price breaking the high (bullish) or low (bearish) is the confirmation: the next candle must agree with the reading.
| Step | Bullish pattern (hammer, bullish engulfing, morning star) | Bearish pattern (shooting star, bearish engulfing, evening star) |
|---|---|---|
| Entry | Buy Stop a few pips above the pattern's high | Sell Stop a few pips below the pattern's low |
| Stop loss | A few pips below the pattern's low | A few pips above the pattern's high |
| Take profit | The next resistance above, or a set multiple of the stop distance | The next support below, or a set multiple of the stop distance |
| Size | From the stop distance and the amount you choose to risk | From the stop distance and the amount you choose to risk |
A Buy Stop or Sell Stop suits this approach because it only opens the trade if price moves through your level. If price never breaks the pattern, no trade opens, and you delete the order. How the risk and the target compare is explained in the risk reward ratio lesson.
How do you set the orders in MetaTrader 5?
In MetaTrader 5, press F9, set Type to Pending Order, choose Buy Stop or Sell Stop, enter the price, volume, stop loss and take profit, then press Place. MetaQuotes' help on executing trades describes the window, and the pending orders lesson walks through it step by step.
- Press F9, or right-click the symbol in Market Watch and choose New Order.
- Set Type to Pending Order and pick Buy Stop (bullish pattern) or Sell Stop (bearish pattern).
- Enter the Price, the Volume in lots, the Stop Loss and the Take Profit.
- Choose an Expiration. Today, or a time a few candles ahead, removes the order if the pattern never confirms.
- Press Place and check that the order appears in the Trade tab of the Toolbox.
Buy orders trigger on the Ask and sell orders on the Bid, as MetaQuotes' basic principles of trading set out, so leave room for the spread when you place a Buy Stop above a pattern's high. After the order triggers, you can drag the stop loss and take profit lines on the chart to adjust them.
What does a hammer trade at support look like?
A hammer at support is bought with a Buy Stop above its high, the stop loss below its low and the take profit at the earlier swing high. EURUSD falls on the H1 chart from 1.0950 to an earlier support area at 1.0840 to 1.0850, and the next H1 candle closes as a hammer:
| Price | Value |
|---|---|
| Open | 1.0852 |
| High | 1.0858 |
| Low | 1.0828 |
| Close | 1.0856 |
The body is 4 pips (1.0856 minus 1.0852), the lower wick is 24 pips (1.0852 minus 1.0828) and the upper wick is 2 pips. The lower wick is six times the body, after a decline, at support: a hammer in the right place.
The plan:
| Item | Working | Result |
|---|---|---|
| Entry (Buy Stop) | 2 pips above the high of 1.0858 | 1.0860 |
| Stop loss | 5 pips below the low of 1.0828 | 1.0823 |
| Stop distance | 1.0860 − 1.0823 | 37 pips |
| Take profit | Earlier swing high | 1.0934 |
| Target distance | 1.0934 − 1.0860 | 74 pips, twice the stop distance |
| Money at risk | 1% of a $5,000 account | $50 |
| Position size | $50 ÷ (37 pips × $10 per pip per lot) | 0.135, rounded down to 0.13 lots |
| Pip value at 0.13 lots | 0.13 × $10 | $1.30 per pip |
Both outcomes, as arithmetic. If EURUSD rises to the take profit, the trade gains 74 × $1.30 = $96.20. If it falls to the stop loss, the trade loses 37 × $1.30 = $48.10. The spread comes off either result. If price never trades above 1.0860, the Buy Stop never triggers and the order expires.
A stop loss closes the position at the next available price once its level is reached, so in a fast move around a data release the fill can land a few pips beyond 1.0823. News, gaps and slippage shows how that works, and checking the economic calendar before placing the order keeps the entry clear of scheduled releases.
What does a shooting star trade at resistance look like?
A shooting star at resistance is sold with a Sell Stop below its low, the stop loss above its high and the take profit at the earlier support. GBPUSD rises on the H4 chart from 1.2600 to an earlier resistance area near 1.2750, and the next H4 candle closes as a shooting star.
Its open is 1.2738, high 1.2772, low 1.2732 and close 1.2735. The body is 3 pips, the upper wick is 34 pips (1.2772 minus 1.2738) and the lower wick is 3 pips.
| Item | Working | Result |
|---|---|---|
| Entry (Sell Stop) | 2 pips below the low of 1.2732 | 1.2730 |
| Stop loss | 5 pips above the high of 1.2772 | 1.2777 |
| Stop distance | 1.2777 − 1.2730 | 47 pips |
| Take profit | Earlier support | 1.2636 |
| Target distance | 1.2730 − 1.2636 | 94 pips, twice the stop distance |
| Size and pip value | 0.10 lots × $10 | $1 per pip |
If GBPUSD falls to the take profit, the trade gains 94 × $1 = $94. If it rises to the stop loss, the trade loses 47 × $1 = $47. Both before spread. The position size calculator and the position sizing lesson set the volume from your own risk amount, and the pip value calculator gives pip values for other pairs.
How do candlestick patterns differ from chart patterns?
Candlestick patterns are built from one to three candles; chart patterns are larger structures built from many candles and swing points. Candlestick patterns compare the bodies, wicks and closes of neighbouring candles; chart patterns compare swing highs, swing lows and drawn lines. The two work well together.
| Candlestick patterns | Chart patterns | |
|---|---|---|
| Size | 1 to 3 candles | Dozens of candles |
| Examples | Doji, hammer, engulfing, morning star | Head and shoulders, double top, flags, triangles |
| What you compare | Bodies, wicks and closes of neighbouring candles | Swing highs, swing lows and drawn lines |
| Where to learn them | This guide and the glossary entries | Chart reversal patterns and chart continuation patterns |
A candlestick pattern often appears inside a chart pattern, for example a bearish engulfing candle at the second peak of a double top. The chart pattern gives you the level and the target; the candlestick pattern gives you the timing and the stop.
Can candlestick patterns be used in any market?
Yes, any market charted with open, high, low and close prices produces candlestick patterns, including forex, gold, indices and share CFDs. What changes is how the candles form. Forex trades almost around the clock on weekdays, while a share CFD follows its exchange's hours, so share candles often open with a gap from the previous close.
Read a share CFD's first candle of the day with that gap in mind, and in forex do the same with the first candle after the weekend. On H1 and shorter timeframes, patterns that form in the busiest hours, such as the London and New York overlap at about 13:00 to 17:00 UTC, are built from more trading than those in the quiet hours. Forex market sessions gives those times in local time.
How do you see candlestick patterns in MetaTrader 5?
Switch the chart to Japanese candlesticks and look for the shapes yourself. MetaTrader 5 can show price as bars, Japanese candlesticks or a line, changed from the toolbar, the Charts menu or the context menu, and it offers 21 timeframes from one minute to one month. It draws the candles; spotting a hammer or an engulfing candle is your call.
A practical exercise on a demo account: scroll back on one pair and timeframe, mark ten hammers or engulfing candles that formed at a level, and for each one write down the entry, stop loss and take profit this guide's method gives. Then note which price was reached first. A trading journal is a good place to keep the notes, and the same process works forward in real time on demo before you trade live.
How do you get better at trading candlestick patterns?
Get better at candlestick patterns by trading only finished candles at marked levels, letting the break confirm the entry and writing your definitions down. Five habits keep your pattern trading consistent from one chart to the next and easy to review in a journal:
- Wait for the close. Trade finished candles only.
- Trade at levels. Mark support and resistance first, then look for patterns there.
- Let the break confirm it. A Buy Stop above the high or a Sell Stop below the low puts you in only when price agrees.
- Check the calendar. Place orders with scheduled releases in mind. See news, gaps and slippage.
- Write your definitions down. For example, "lower wick at least twice the body". Fixed rules stop you seeing patterns everywhere. Breakouts and fakeouts applies the same discipline to levels.
Frequently asked questions
Which candlestick pattern is the most reliable?
Where a pattern forms matters more than which pattern it is. A hammer or engulfing candle at a tested support or resistance level, after a clear move and confirmed by a break of its high or low, gives you a clear entry, stop loss and target. The same shape in the middle of a range gives you none of those.
How many candlestick patterns are there?
There is no official list. Wikipedia's article on candlestick patterns counts 42 recognised patterns, and some reference books describe many more. Most traders learn a handful well, such as the doji, hammer, shooting star, engulfing candle and morning star.
Do candlestick patterns work in forex?
Candlestick patterns form in forex the same way as in any market, because forex charts record open, high, low and close for each period. Read them at levels and on the timeframe your plan uses, and set the stop loss and position size before you place the order.
What is the difference between a bullish and a bearish candlestick pattern?
A bullish pattern is one traders read as buyers taking control, usually after a fall, such as the hammer or morning star. A bearish pattern is the opposite, after a rise, such as the shooting star or evening star. You buy above a bullish pattern's high and sell below a bearish pattern's low.
Where do you put the stop loss on a candlestick pattern?
Put it a few pips beyond the other end of the pattern: below the low of a hammer or bullish engulfing candle, or above the high of a shooting star or bearish engulfing candle. That distance then sets your position size for the amount you choose to risk.
Sources
- MetaQuotes, MetaTrader 5 Help: View and Configure Charts, accessed 19 October 2026: charts can be shown as bars, Japanese candlesticks or a broken line, and 21 timeframes from one minute to one month are available. https://www.metatrader5.com/en/terminal/help/charts_analysis/charts
- MetaQuotes, MetaTrader 5 Help: Executing Trades, accessed 19 October 2026: opening the order window with F9 or New Order, choosing Pending Order in the Type field, the price, volume, stop loss, take profit and expiration fields, the Place button, and dragging trade levels on the chart. https://www.metatrader5.com/en/terminal/help/trading/performing_deals
- MetaQuotes, MetaTrader 5 Help: Basic Principles, accessed 19 October 2026: Buy Stop and Sell Stop pending orders, buy orders triggering on the Ask and sell orders on the Bid, and stop loss and take profit closing the position. https://www.metatrader5.com/en/terminal/help/trading/general_concept
- Wikipedia, Candlestick pattern, accessed 19 October 2026: origins of candlestick charting in Japanese rice trading, and a count of 42 recognised patterns divided into simple and complex. https://en.wikipedia.org/wiki/Candlestick_pattern
Practise what you learned
Open an account to use MetaTrader 5. Start on a demo account before risking real money.
Open Account