
Chart Patterns: Head and Shoulders, Double Tops and Bottoms
Chart patterns are repeating shapes in price, such as head and shoulders and double tops, that traders use to read when a trend is stalling and to plan entries, stops and measured moves at clear levels.
Module 6 · Lesson 2 of 4
What you'll learn
- What chart patterns are, and how reversal patterns differ from continuation patterns.
- How to recognise a head and shoulders, an inverse head and shoulders, a double top and a double bottom.
- How analysts draw the neckline and measure the pattern's height.
- How confirmation works, and what a failed pattern looks like.
What are chart patterns?
Chart patterns are repeating shapes that price draws on a chart, which traders use to describe how buying and selling have behaved. Patterns are built from swing highs and lows, the turning points you mark when drawing support and resistance. Traders use them to spot a stalling trend and to place entries and stops at clear levels.
The US futures regulator, the CFTC, defines technical analysis as an approach to forecasting prices that examines patterns of price change. This lesson is part of the Technical Analysis I: Price Structure module.
Key terms
- Chart pattern: a recognisable shape formed by a series of highs and lows.
- Neckline: the line across the turning points between the peaks (or troughs) of a pattern.
- Confirmation: a candle closing beyond the neckline, which completes the shape.
What are the main types of chart patterns?
The two main types of chart patterns are reversal patterns, which describe a trend that has stalled and may turn, and continuation patterns, which describe a pause inside a trend that may carry on. Some writers add a third group, bilateral patterns, for shapes that can break either way.
| Reversal patterns | Continuation patterns | |
|---|---|---|
| What they describe | A trend failing to make new highs or lows | A pause or sideways drift inside a trend |
| Examples | Head and shoulders, double top, double bottom | Flags, pennants, triangles |
| Invalidated when | The old trend carries on | Price turns the other way |
Flags, pennants and triangles are explained in the chart continuation patterns lesson. A rising or falling wedge often marks a move running out of steam before it turns.
What is a head and shoulders pattern?
A head and shoulders pattern is three peaks in a row, with the middle peak (the head) higher than the two outer peaks (the shoulders). It forms after a rise. The CFTC glossary describes it as a formation generally considered predictive of a price reversal. Traders read it as a sign the uptrend is losing strength.
- Left shoulder: price rises to a peak, then falls back.
- Head: price rises to a higher peak, then falls back to about the same low.
- Right shoulder: price rallies again but stops below the head.
- Neckline: a line joins the two lows between the peaks.
What is an inverse head and shoulders?
An inverse head and shoulders is the upside-down version: three troughs, with the middle trough lowest, forming after a fall. The CFTC calls it a head and shoulders bottom. Its neckline joins the two highs between the troughs, and traders read it as a sign the downtrend is losing strength.
What are double top and double bottom patterns?
A double top is two peaks at roughly the same price with a dip between them, and a double bottom pattern is its mirror: two troughs at roughly the same price with a rally between them. Both describe price failing twice at the same area. A double top's neckline is the low between the peaks.
| Pattern | Forms after | Shape | Neckline joins |
|---|---|---|---|
| Head and shoulders | A rise | Three peaks, middle highest | The two lows between peaks |
| Inverse head and shoulders | A fall | Three troughs, middle lowest | The two highs between troughs |
| Double top | A rise | Two peaks at a similar price | The low between the peaks |
| Double bottom | A fall | Two troughs at a similar price | The high between the troughs |
| Triple top or bottom | A rise or a fall | Three peaks or troughs at a similar price | The turning points between them |
How do you draw the neckline?
You draw the neckline by joining the turning points between the peaks (or troughs) of the pattern. On a head and shoulders it runs through two lows, so it can slope. A double top or bottom has one turning point, so most chart readers draw it flat. Draw it on the same points every time so your measurements stay consistent.
- Mark the peaks (or troughs) of the shape.
- Find the turning point between each pair.
- Join them with a line and extend it to the right.
- Note whether any candle has closed beyond it.
How is the measured move calculated?
The measured move is a convention: analysts take the pattern's height from the head (or peak) to the neckline and project that distance beyond the neckline. Traders use the projection as a reference for a take-profit level and to compare the pattern's size with the distance to the stop.
Pattern height = head price − neckline price. For a top, the projection is neckline − height. For a bottom, it is neckline + height.
Worked example: a head and shoulders on EURUSD
| Step | Price or calculation | Result |
|---|---|---|
| Left shoulder | Peak | 1.0900 |
| Head | Highest peak | 1.0950 |
| Right shoulder | Lower peak | 1.0905 |
| Neckline | Low between the peaks | 1.0850 |
| Pattern height | 1.0950 − 1.0850 | 0.0100 = 100 pips |
| Conventional projection | 1.0850 − 0.0100 | 1.0750 |
At 0.10 lot of EURUSD, one pip is worth about $1, so the 100-pip distance between the neckline and the projection is about 100 × $1 = $100. Pip value is explained in the lots, pips and pip value lesson, and the pip value calculator works it out for other pairs and sizes.
Many chart readers treat a close back above the right shoulder as the point where the pattern is invalidated, which makes it a common stop reference. From 1.0850 to 1.0905 is 55 pips, or about $55 at 0.10 lot. Measured from the neckline, that is 100 pips of projected move against 55 pips of risk, about 1.8 to 1. Sizing against that distance is covered in Module 5, Risk Management.
What separates confirmation from anticipation?
Confirmation means waiting for a candle to close beyond the neckline before calling a pattern complete, while anticipation means acting on the shape before that close. Confirmation gives a later entry on a completed pattern; anticipation gives a better price on a shape still forming.
The same wait-for-the-close idea applies to smaller candlestick patterns such as the hammer and engulfing candle.
| Confirmation | Anticipation | |
|---|---|---|
| When the pattern is called | After a close beyond the neckline | Before the neckline is broken |
| Trade-off | Price may already have moved far from the right shoulder | The shape may never complete |
After a break, price sometimes returns to test the neckline from the other side, often called a retest, which some traders use as their entry. Retests and false breaks are covered in the breakouts and fakeouts lesson.
Does volume matter in chart patterns?
Volume is the amount of trading in each period, and many chart readers check whether it rises as price breaks a neckline. The CFTC lists changes in volume among what technical analysis examines. Forex has no single exchange, so MetaTrader 5's Volumes indicator counts price changes per period instead, a rough proxy for activity.
What does a failed chart pattern look like?
A failed chart pattern is one where price breaks the other way, or closes back through the neckline after confirming. A double top can turn into a new high, and a confirmed head and shoulders can climb back above its neckline. Skilled traders plan for this by setting the stop where the pattern is invalidated before they enter.
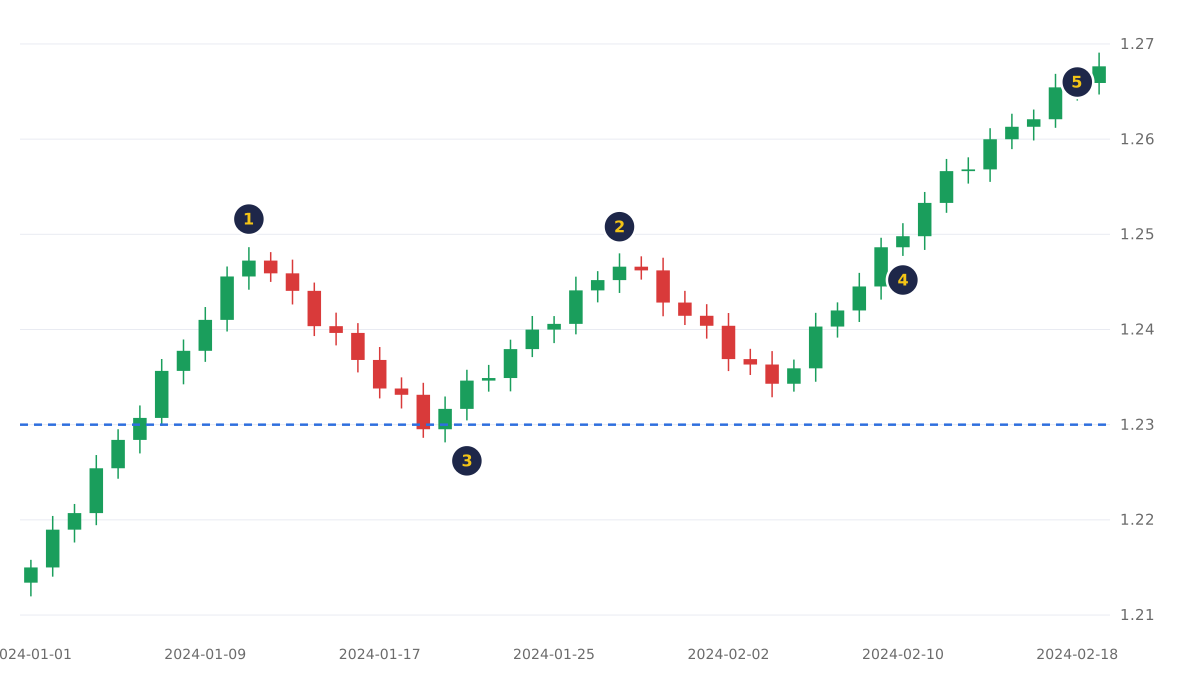
- First peak.
- Second peak at roughly the same level, where the shape looks like a double top.
- The neckline, drawn across the low between the peaks. After the second peak, price never closes below it.
-
Price closes above the peaks instead, and the rise continues.
-
Use the invalidation point. The neckline and the right shoulder give every pattern a defined entry, stop and measured move.
- Allow for gaps. After news or a weekend, price can open beyond the neckline or the stop and fill at a worse price.
- Read patterns as they form. Patterns look obvious on old charts; practise on live charts, where the shape is still incomplete.
Try it on demo
On a demo account in MetaTrader 5, open a D1 chart of a major pair and look back over the past year. Find a shape that looks like a head and shoulders or a double top, and draw its neckline with the Trend Line or Horizontal Line from the Insert menu. Note the height and projection, then scroll forward: did it confirm, fail, or never complete?
Quick check
- The neckline of a double top is drawn
- A head and shoulders top has
- A head is at 1.0950 and the neckline at 1.0850. The conventional measured move projects to
- In chart reading, a pattern is usually called confirmed when
- A double bottom has two troughs at 1.2500 and a peak between them at 1.2600. The conventional projection is
Frequently asked questions
What are the three types of chart patterns?
The three types are reversal patterns, such as head and shoulders and double tops; continuation patterns, such as flags, pennants and triangles; and bilateral patterns, which can break either way, such as a symmetrical triangle.
Is a head and shoulders pattern bullish or bearish?
A head and shoulders top is usually read as bearish because it forms after a rise that has stalled. The inverse head and shoulders is usually read as bullish. Each is confirmed by a candle close beyond its neckline.
How do you trade a head and shoulders pattern?
Chart readers wait for a candle to close below the neckline, place the stop above the right shoulder, and use the pattern's height projected below the neckline as the measured move. Size the position so the distance to the stop fits your risk limit.
What is the difference between a double top and a head and shoulders?
A double top has two peaks at about the same price, while a head and shoulders has three peaks with the middle one highest. Both form after a rise, and both use a neckline across the lows between the peaks.
Sources
- Commodity Futures Trading Commission (CFTC), CFTC Glossary, accessed 19 October 2026: the definition of head and shoulders as a formation generally considered predictive of a price reversal, the head and shoulders bottom, and technical analysis as an approach to forecasting prices that examines patterns of price change and changes in volume. https://www.cftc.gov/LearnAndProtect/AdvisoriesAndArticles/CFTCGlossary/index.htm
- MetaQuotes, MetaTrader 5 Help: Lines, accessed 19 October 2026: a trend line is drawn through two points and a horizontal line marks levels such as support and resistance. https://www.metatrader5.com/en/terminal/help/objects/lines
- MetaQuotes, MetaTrader 5 Help: Analytical Objects, accessed 19 October 2026: objects are added from the Insert menu or the Line Studies toolbar and are plotted manually. https://www.metatrader5.com/en/terminal/help/charts_analysis/objects
- MetaQuotes, MetaTrader 5 Help: Volumes, accessed 19 October 2026: for the Forex market, the Volumes indicator shows the number of price changes within each period of the selected timeframe. https://www.metatrader5.com/en/terminal/help/indicators/volume_indicators/volumes
Practise what you learned
Open an account to use MetaTrader 5. Start on a demo account before risking real money.
Open Account