
Rising Wedge and Falling Wedge Pattern
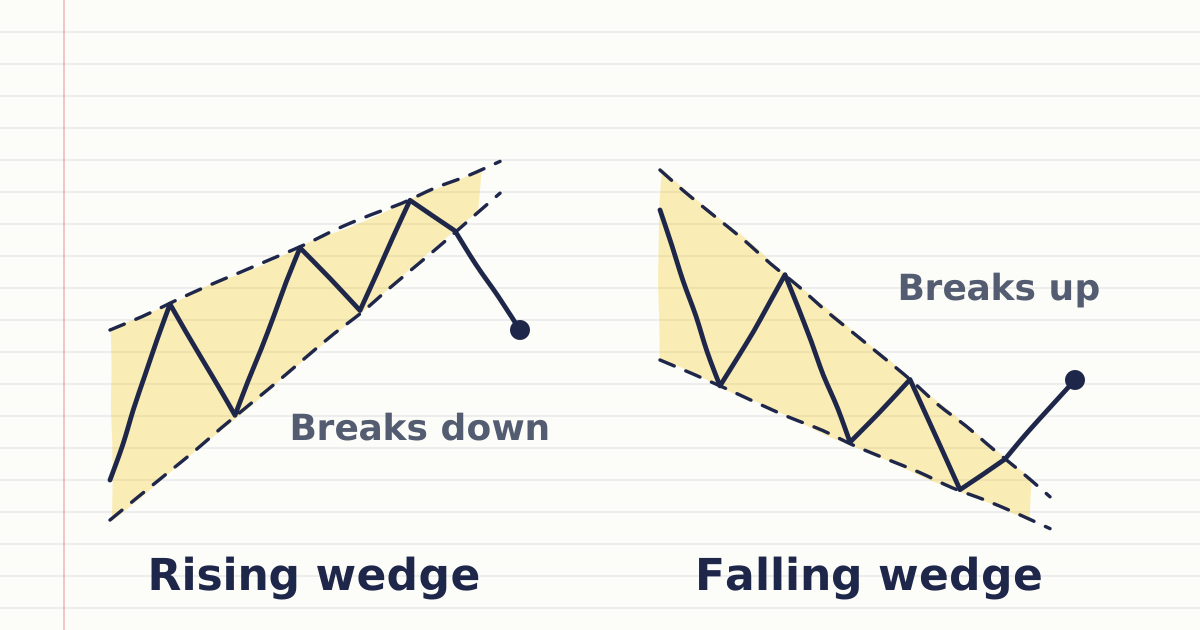
A wedge pattern is a narrowing price range between two trendlines that slope the same way. A rising wedge slopes up and usually breaks down; a falling wedge slopes down and usually breaks up.
A rising wedge is a narrowing price range between two upward-sloping trendlines that usually breaks down; a falling wedge is the mirror image, sloping down, and usually breaks up. In a rising wedge the lower line is steeper than the upper one.
Both show a move losing steam: each new high or low gains less ground than the last. Traders wait for a candle to close outside the wedge and trade in the direction of that break. The chart reversal patterns lesson puts wedges alongside double tops and head and shoulders.
How do you spot a rising wedge and a falling wedge?
Draw one line through the swing highs and one through the swing lows: if both slope the same way and converge, it is a wedge. Thinkorswim's pattern reference describes the rising wedge as two upward lines with the upper one's slope smaller than the lower one's.
It describes the falling wedge as two downward lines needing at least five touches between them.
| Rising wedge | Falling wedge | |
|---|---|---|
| Both lines slope | Up | Down |
| Steeper line | The lower one | The upper one |
| Usual break | Down, through the lower line | Up, through the upper line |
| Read as | Bearish | Bullish |
How is a wedge different from a triangle?
In a wedge both lines slope the same way; in a triangle the lines slope toward each other from opposite directions or one of them is flat. An ascending triangle has a flat top and rising lows; a rising wedge has rising highs as well, just rising more slowly than the lows.
That slowing is the point of the pattern: buyers are still pushing higher, but each push gains less.
A pennant is a small, symmetrical triangle after a sharp move, and a bull flag is a short channel sloping against the trend; both are continuation patterns. A wedge can act as a reversal or a continuation pattern, and both of its lines slope the same way.
Worked example: rising wedge on GBPUSD
GBPUSD makes highs at 1.2700, 1.2740 and 1.2770, and lows at 1.2600, 1.2665 and 1.2715. The lows rise by 65 then 50 pips, the highs by 40 then 30, so the lines converge. A candle then closes at 1.2690, below the lower line. You sell 0.10 lot, about $1 a pip, at the close and place the stop above the last high.
| Step | Calculation | Result |
|---|---|---|
| Risk to the stop | 1.2770 − 1.2690 | 80 pips, $80 |
| Widest part of the wedge | 1.2700 − 1.2600 | 100 pips |
| Conventional target | 1.2690 − 0.0100 | 1.2590 |
| Reward at the target | 100 pips × $1 | $100 |
That is a reward-to-risk of 1.25 to 1. The risk-reward ratio lesson shows how to judge whether that is enough for your plan.
How do you draw a wedge in MetaTrader 5?
In MetaTrader 5 you draw a wedge with two Trend Line objects, each anchored to at least two swing points and extended to the right. The tool sits on the Insert menu or the Line Studies toolbar, and extending the lines shows where they will meet.
Set a price alert just beyond the line you expect to break.
What do traders often get wrong about rising wedges?
The common mistake is reading a rising wedge as bullish because price is going up, when it is usually read as bearish because each rally gains less ground. Thinkorswim notes that rising wedges often appear as weak rallies inside a downtrend and break down to continue it, while upward breaks are less common.
Wait for the close outside the line before acting.
Sources
- Thinkorswim (Charles Schwab), Rising Wedge, pattern reference, accessed 26 October 2026: two lines through peaks and bottoms, both headed upward, the upper slope smaller than the lower; often a weak rally in a downtrend that breaks downward; upward breakouts less common. https://toslc.thinkorswim.com/center/reference/Patterns/Classic-Patterns/Rising-Wedge
- Thinkorswim (Charles Schwab), Falling Wedge, pattern reference, accessed 26 October 2026: two downward-sloping lines through peaks and bottoms; at least five reversals; generally regarded as bullish, with breakouts expected through the upper line. https://toslc.thinkorswim.com/center/reference/Patterns/Classic-Patterns/Falling-Wedge
- MetaQuotes, MetaTrader 5 Help: Lines, accessed 26 October 2026: a trend line is drawn through two points; objects are added from the Insert menu or the Line Studies toolbar. https://www.metatrader5.com/en/terminal/help/objects/lines
Practise what you learned
Open an account to use MetaTrader 5. Start on a demo account before risking real money.
Open Account