
Bull Flag
A bull flag is a short pause after a sharp price rise, where price drifts down or sideways in a small channel; a close above the channel confirms it.
A bull flag is a short pause after a sharp price rise: the rise forms the "pole", and the pause is a small channel that drifts down or sideways against it. Chart readers call it a continuation pattern and treat a candle close above the flag's upper line as the confirmation.
What does a bull flag look like?
A bull flag looks like a flag on a pole: a fast, almost straight rise, then a short, shallow channel that slopes gently down or sideways. The flag gives back only a small part of the pole and is short compared with it. The table lists what to look for.
| Part | What to look for |
|---|---|
| Pole | A fast, almost straight rise |
| Flag | Two roughly parallel lines sloping gently down or sideways |
| Depth | The flag gives back only a small part of the pole |
| Length | The flag is short compared with the pole |
The mirror image after a sharp fall is the bear flag. If the pause narrows into a small triangle instead of a parallel channel, it is usually called a pennant. Both are covered in the chart continuation patterns lesson.
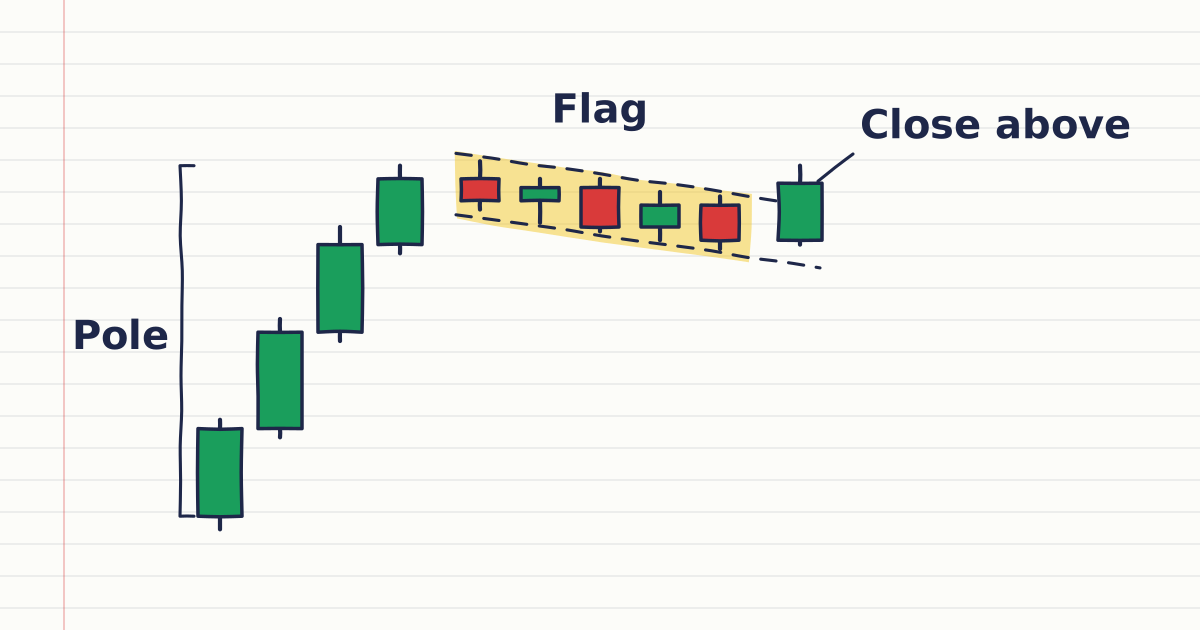
Worked example: bull flag on EURUSD
EURUSD rises from 1.0800 to 1.0880, an 80-pip pole. It then drifts down in a small channel to 1.0860 over several candles. A candle then closes at 1.0875, above the channel's upper line.
| Step | Calculation | Result |
|---|---|---|
| Pole height | 1.0880 − 1.0800 | 80 pips |
| Breakout close | Above the upper line | 1.0875 |
| Conventional measured move | 1.0875 + 0.0080 | 1.0955 |
| Invalidation | A close below the lower line | Shape no longer a flag |
The measured move is a convention for comparing a pattern's size with the distance to its invalidation level. At 0.10 lot, a pip on EURUSD is about $1, so a long position gains about $80 if price rises 80 pips and loses about $80 if it falls 80 pips.
What confirms a bull flag?
A bull flag is confirmed by a candle close above the flag's upper line, after a shallow pullback that keeps most of the pole. A wick through the line is not enough, and a close back inside the channel cancels the breakout. Volume on forex charts needs care, as the last point explains.
- A close, not a wick. Chart readers wait for a candle to close above the upper line; a close back inside the channel cancels the breakout. See breakouts and fakeouts.
- A shallow pullback. The flag gives back a small part of the pole. If the pullback erases most of it, the shape reads as a range or a reversal instead.
- Volume in forex is not traded volume. MetaTrader 5's Volumes indicator counts price changes for forex, so "light volume in the flag" means fewer price changes, not fewer contracts.
How do you draw a bull flag in MetaTrader 5?
In MetaTrader 5, draw the flag with an equidistant channel from Insert, Objects, Channels, so its two lines stay parallel. A trend line can mark the pole. Then watch for a candle to close above the channel's upper line, which confirms the flag, or below its lower line, which cancels it.
What do traders often get wrong about bull flags?
A common mistake is reading a bull flag as a promise that price will keep rising, when it only describes a rise followed by a pause. A close above the upper line confirms the pattern, and a close below the lower line cancels it, so traders plan both outcomes, including their position size, before entering.
Sources
- MetaQuotes, MetaTrader 5 Help: Channels, accessed 19 October 2026: channels are added from Objects, Channels in the Insert menu or the Line Studies toolbar; the lines of the equidistant channel are always parallel. https://www.metatrader5.com/en/terminal/help/objects/channels
- MetaQuotes, MetaTrader 5 Help: Lines, accessed 19 October 2026: a trend line is drawn through two points. https://www.metatrader5.com/en/terminal/help/objects/lines
- MetaQuotes, MetaTrader 5 Help: Volumes, accessed 19 October 2026: for forex, the Volumes indicator shows the number of price changes in each period. https://www.metatrader5.com/en/terminal/help/indicators/volume_indicators/volumes
Practise what you learned
Open an account to use MetaTrader 5. Start on a demo account before risking real money.
Open Account