
Flag Pattern: Bull and Bear Flags, Pennants and Triangles
A flag pattern is a short pause after a sharp price move, made of a steep pole and a small channel that drifts against it. Traders read it as a continuation pattern and use the pole’s height to project a measured move.
Module 6 · Lesson 3 of 4
What you'll learn
- What a flag pattern is, how bull and bear flags are built, and how to identify one.
- How pennants, triangles and rectangles differ from flags.
- How the measured move is calculated from the pole height.
- What a failed flag looks like, and how to draw patterns in MetaTrader 5.
What is a flag pattern?
A flag pattern is a short pause after a sharp price move, made of a steep "pole" and a small channel that drifts against that move. Its two edges are roughly parallel. Traders call it a continuation pattern: the pause reads as the market catching its breath inside the trend, with traders watching for the earlier move to resume.
This lesson is part of the Technical Analysis module. It builds on the trends and ranges lesson, because every continuation pattern is a pause inside a trend.
Definitions
- Pole: the sharp, almost straight move that comes before the pause.
- Flag: the pause itself, a small parallel channel that slopes against the pole.
- Breakout: a close beyond one edge of the pattern.
What is a bull flag?
A bull flag is a flag pattern that follows a sharp rise: the pole points up and the flag drifts gently down or sideways. Traders often read a close above the flag's upper line as the rise resuming. A close below the flag's lower line invalidates the pattern.
What is a bearish flag?
A bearish flag, or bear flag, is the mirror image of a bull flag: a sharp fall forms the pole, then price drifts gently up or sideways in a small channel. Traders often read a close below the flag's lower line as the fall resuming. A close above the flag's upper line invalidates it.
| Bull flag | Bear flag | |
|---|---|---|
| Pole | Sharp rise | Sharp fall |
| Flag slopes | Down or sideways | Up or sideways |
| Edge traders watch | Upper line | Lower line |
| Invalidated by | A close below the flag | A close above the flag |
How do you identify a flag pattern?
You identify a flag pattern by five features: a sharp pole, two parallel lines sloping against it, a shallow pause, a short pause, and quieter activity while the pause forms. If one is missing, the shape may be a range or the start of a reversal.
| Feature | What to look for | Not a flag if |
|---|---|---|
| Pole | A fast, almost straight move | A slow, choppy move |
| Lines | Parallel, sloping against the pole | Widening, or sloping with the pole |
| Depth | Gives back a small part of the pole | Erases most of the pole |
| Length | Short next to the pole | Drags on far longer than the pole |
| Activity | Quieter than in the pole | No change |
Chart readers often describe volume as heavy in the pole, lighter in the flag and rising at the breakout. For forex, MetaTrader 5's Volumes indicator counts price changes in each period; only for stock symbols does it show the volume actually traded. It describes activity, not direction.
How do pennants, triangles and rectangles differ from flags?
Pennants, triangles and rectangles are other shapes a pause can take; they differ in how the two boundary lines slope. A flag has parallel lines tilted against the trend. A pennant is a tiny triangle after a pole. Triangles have converging lines and no pole needed. A rectangle has two flat, parallel lines, like a short range.
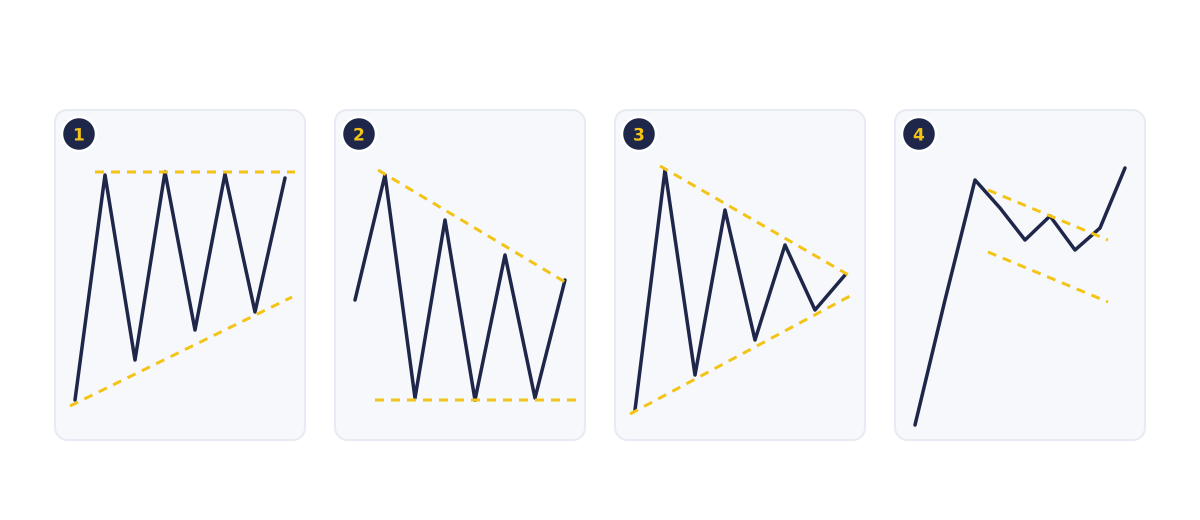
- Ascending triangle: a flat upper line and rising lows.
- Descending triangle: a flat lower line and falling highs.
- Symmetrical triangle: falling highs and rising lows that converge.
- Bull flag: a sharp rise, then a small parallel channel sloping down.
| Pattern | Shape of the pause | Boundary lines | Usually follows | How traders often read it |
|---|---|---|---|---|
| Flag | Small tilted channel | Parallel, sloping against the pole | A sharp pole | Possible continuation of the pole |
| Pennant | Small triangle | Converging | A sharp pole | Possible continuation of the pole |
| Ascending triangle | Wedge with a flat top | Flat top, rising bottom | Any trend or range | Buyers pressing on a ceiling |
| Descending triangle | Wedge with a flat bottom | Flat bottom, falling top | Any trend or range | Sellers pressing on a floor |
| Symmetrical triangle | Narrowing wedge | Both sloping inwards | Any trend or range | Undecided; can break either way |
| Rectangle | Flat range | Flat and parallel | Any trend | A range between support and resistance |
The flat edges of triangles and rectangles are support and resistance levels: zones where price has reacted before. When both lines slope the same way, the pattern is a wedge instead.
How do you calculate a flag pattern's measured move?
The measured move is a convention: take the height of the pole and add it to the breakout price for a bull flag, or subtract it for a bear flag. For triangles and rectangles, traders use the height of the pattern at its widest point instead. Traders use the result as a take-profit reference.
- Bull flag projection = breakout price + pole height.
- Bear flag projection = breakout price − pole height.
- Triangle or rectangle projection = breakout price ± height of the pattern's widest part.
Chart readers use the projection to compare a pattern's size with its risk, as the failed-flag example below shows.
Worked example: a bull flag on GBPUSD
This example uses synthetic prices.
GBPUSD rises sharply from 1.2600 to 1.2700, a 100-pip pole, then drifts down in a small channel. The flag's highs fall from 1.2700 to 1.2685 and its lows fall from 1.2675 to 1.2660.
| Step | Calculation | Result |
|---|---|---|
| Pole height | 1.2700 − 1.2600 | 100 pips |
| Breakout level (flag's upper line) | Read from the chart | 1.2685 |
| Conventional projection | 1.2685 + 100 pips | 1.2785 |
| Flag's low | Read from the chart | 1.2660 |
The projection sits 100 pips above the breakout, and the flag's low at 1.2660 marks where the pattern is invalidated.
What does a failed flag look like?
A failed flag is one where price breaks out the "wrong" way, or breaks out and then falls straight back inside. In the example, a failure is a close below the flag's low at 1.2660. Measuring the pattern tells you the cost of that outcome before you enter.
Suppose a position had been opened at 1.2685 with a stop-loss 5 pips below the flag's low, at 1.2655. That distance is 30 pips. At 0.10 lot of GBPUSD, one pip is worth about $1, so a failed flag costs about 30 × $1 = $30 when the stop fills at its price; spread and slippage add to that. Against the 100-pip projection from the same 1.2685 entry, that is about 3.3 to 1. The pip value calculator works this out for other pairs and sizes.
Why do flag patterns fail, and how do traders plan for it?
Flag patterns fail when fresh news, a shift in the wider trend or a lack of follow-through sends price the other way after the pause. Skilled traders plan for this before entering: they mark the invalidation level, size the position to the stop and act on a close beyond the flag's edge rather than a touch.
- Wait for the close. A close beyond the edge is the breakout; false breakouts are covered in the next lesson.
- Draw consistently. Use the same points every time so your breakout level and stop are repeatable.
- Allow for gaps. Price can jump past a flag's edge and a stop near it around news or a weekend, filling at a worse price.
- Practise on live charts. A pause only becomes a clear flag once price moves on; while it forms, it can still turn into a range or a reversal.
How do you draw a flag pattern in MetaTrader 5?
In MetaTrader 5, you can draw a flag with the Equidistant Channel and a triangle or pennant with two Trendlines, both from the Insert menu or the Line Studies toolbar. MetaQuotes' channels help says the channel's two lines are always parallel, and a trendline needs two points.
- Find a sharp move followed by a short pause.
- For a flag, choose Insert, then Objects, then Channels, then Equidistant Channel. Click the flag's first high, drag to its last high, then drag the second line to the lows.
- For a triangle or pennant, draw one Trendline across the highs and another across the lows.
- For a rectangle, use the Rectangle shape and set the price of its two points.
How to draw sloping lines well is covered in the trend lines and channels lesson.
Try it on demo
On a demo account in MetaTrader 5, open an H1 GBPUSD chart and find a sharp move followed by a pause. Draw it with the Equidistant Channel, note the pole height and projection, and mark where the pattern would fail. Then record which way it actually broke.
Quick check
- A bull flag is made of
- A pennant differs from a flag because its pause is shaped like
- An ascending triangle has
- A pole runs 100 pips and the flag breaks out at 1.2685. The conventional projection is
- A bull flag breaks out at 1.2685 with a stop at 1.2655. At 0.10 lot of GBPUSD, about $1 per pip, a loss at the stop is about
Frequently asked questions
Is a flag pattern bullish or bearish?
It can be either. A bull flag follows a sharp rise and a bear flag follows a sharp fall. Each is read as a continuation of the move before it, and each is invalidated by a close beyond its opposite edge.
What is the difference between a flag and a pennant?
The shape of the pause. A flag's lines are parallel, like a tilted channel; a pennant's lines converge, like a small triangle. Both follow a sharp pole.
How long does a flag pattern last?
There is no fixed length. A flag is usually short compared with the pole; a pause that drags on far longer looks more like a range.
How do you trade a bull flag?
Chart readers wait for a candle to close above the flag's upper line, place the stop below the flag's low, and project the pole height above the breakout as the measured move. In the GBPUSD example, that is a 1.2685 breakout, a 1.2655 stop and a 1.2785 projection.
Sources
- MetaQuotes, MetaTrader 5 Help: Channels, accessed 19 October 2026: channels are added from Objects, Channels in the Insert menu or the Line Studies toolbar, and the lines of the equidistant (trend) channel are always parallel, set by two points. https://www.metatrader5.com/en/terminal/help/objects/channels
- MetaQuotes, MetaTrader 5 Help: Lines, accessed 19 October 2026: a trendline helps to explore trends in price changes and is drawn through two points. https://www.metatrader5.com/en/terminal/help/objects/lines
- MetaQuotes, MetaTrader 5 Help: Volumes, accessed 19 October 2026: for forex, the Volumes indicator shows the number of price changes in each period; for stock symbols it shows volumes actually traded. https://www.metatrader5.com/en/terminal/help/indicators/volume_indicators/volumes
- MetaQuotes, MetaTrader 5 Help: Rectangle, accessed 19 October 2026: a rectangle is drawn by setting an initial point and dragging to size, with a date and price for each of its two points and a fill setting. https://www.metatrader5.com/en/terminal/help/objects/shapes/rectangle
Practise what you learned
Open an account to use MetaTrader 5. Start on a demo account before risking real money.
Open Account