
Consolidation
Consolidation in forex is a period when price moves sideways in a narrower range than before, with no clear trend, often after a strong move.
Consolidation in forex is a period when price moves sideways within a narrower range than it did before, without a clear trend. It often follows a strong move, as if the market is pausing. There is no official threshold, so traders judge narrowness against recent candles, as in the example below.
The US Commodity Futures Trading Commission's glossary uses the word congestion for the same idea: a period of repetitious and limited price fluctuations.
How do you spot consolidation?
You spot consolidation when swings stop making progress, candles get smaller and volatility readings such as ATR fall. Together these signs show a market that has stopped trending and is moving sideways in a narrower range than before. The three checks are below.
- Swings stop making progress. Highs and lows no longer step clearly higher or lower, as described in trends and ranges.
- Candles get smaller. Bodies and wicks shrink compared with the candles before.
- Volatility readings fall. The ATR indicator drops and Bollinger Bands narrow.
Consolidation can take different shapes. Chart readers call a flat, parallel range a rectangle; narrowing swings a triangle; a short, tilted pause after a sharp move a bull flag or bear flag.
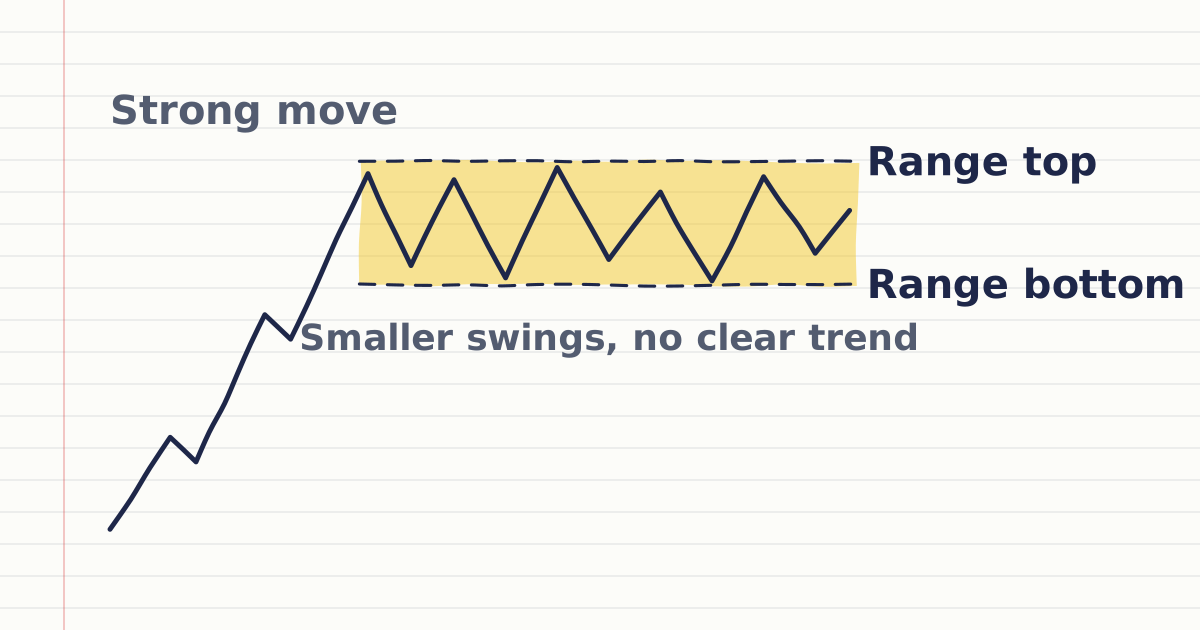
Worked example: consolidation on EURUSD
Over the previous two weeks, EURUSD's average daily range (high minus low) was about 80 pips. For the next three days it trades between 1.0850 and 1.0890.
| Measure | Calculation | Result |
|---|---|---|
| Consolidation range | 1.0890 − 1.0850 | 40 pips |
| Compared with a normal day | 40 ÷ 80 | Half of one average day, over three days |
At 0.10 lot of EURUSD, about $1 per pip, the whole three-day range is worth about $40 of movement. When price finally closes outside 1.0850–1.0890, that is a breakout; the breakouts and fakeouts lesson covers how traders confirm one.
Why does consolidation matter to a trader?
Consolidation matters because its top and bottom give clear levels for pending orders, stops and breakout plans. A range also shows where ordinary movement ends, so stops go beyond the edges, both breakout directions get a plan, and scheduled news is checked before it can run price through the whole range. The points are below.
- The range gives clear levels. Its top and bottom are where traders place pending orders for a breakout, or stops for a trade inside the range.
- Stops go beyond the edges. A stop just inside a tight range is reached by ordinary movement once the market moves again.
- Mark both edges. Consolidation after a rise can break either way, so traders plan for a close above the top and a close below the bottom.
- Check the news times. A scheduled release can move price through the whole range in seconds.
How do you mark consolidation in MetaTrader 5?
In MetaTrader 5, mark the top and bottom of the range with a rectangle or two horizontal lines across the swing highs and lows. Then add Average True Range to see whether candles are getting smaller. A close outside the marked box is the breakout to watch for.
What do traders often get wrong about consolidation?
A common mistake is assuming consolidation means the trend will continue, when a sideways range can also be where a trend ends. Some charting books treat consolidation as a pause inside a trend, but the range itself does not show which way it will break. Traders let the breakout close decide.
Sources
- Commodity Futures Trading Commission (CFTC), CFTC Glossary, accessed 19 October 2026: congestion, in technical analysis, as a period characterised by repetitious and limited price fluctuations. https://www.cftc.gov/LearnAndProtect/AdvisoriesAndArticles/CFTCGlossary/index.htm
- MetaQuotes, MetaTrader 5 Help: Rectangle, accessed 19 October 2026: a rectangle is drawn by setting an initial point and dragging to size. https://www.metatrader5.com/en/terminal/help/objects/shapes/rectangle
- MetaQuotes, MetaTrader 5 Help: Average True Range, accessed 19 October 2026: ATR is an indicator that shows the volatility of the market. https://www.metatrader5.com/en/terminal/help/indicators/oscillators/atr
Practise what you learned
Open an account to use MetaTrader 5. Start on a demo account before risking real money.
Open Account