
ATR Indicator
The ATR indicator (average true range) measures volatility as the average size of recent candles’ true ranges, in price units, and says nothing about direction.
The ATR indicator, short for average true range, measures volatility: the average size of each candle's true range over a chosen number of candles. It is shown in price units, so on EURUSD a reading of 0.0040 means about 40 pips. A higher ATR means bigger candles. It does not show direction.
Traders use ATR to set stop distance and position size to current volatility, so a quiet market and a fast one get the same money at risk.
What is true range?
True range is the largest of three distances: the high minus the low, the high minus the previous close, and the previous close minus the low. Each is taken as a positive number. Including the previous close means gaps between candles are counted. ATR then averages these values over the chosen period.
MetaTrader 5's ATR help page defines true range this way and describes ATR as a moving average of these values that shows the volatility of the market.
Worked example: ATR on EURUSD
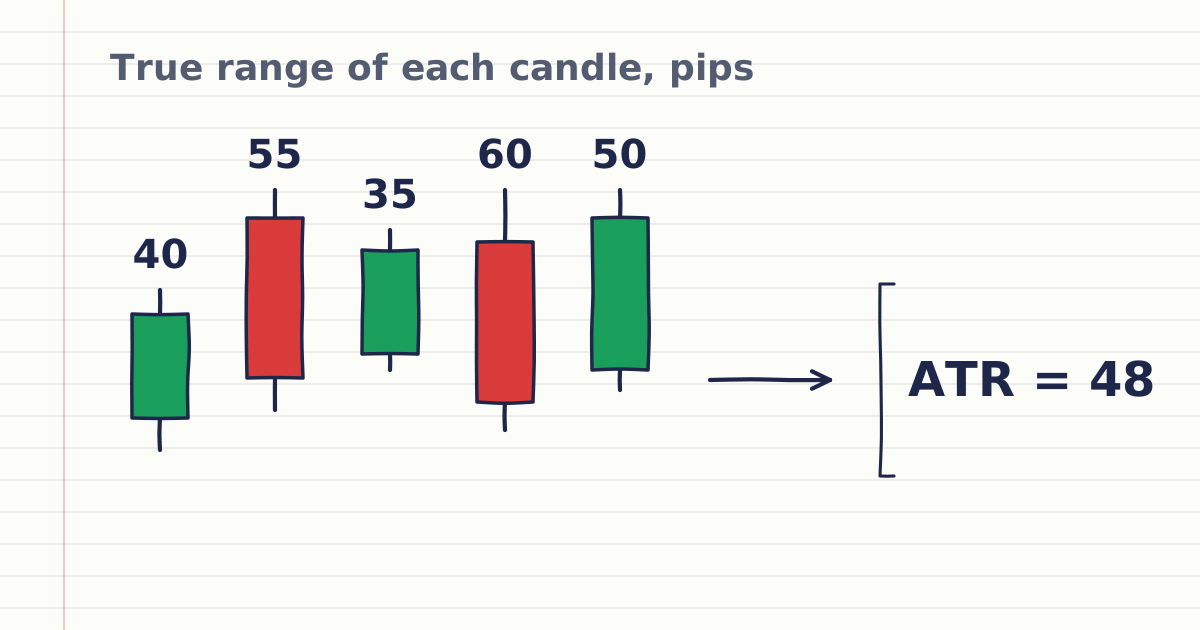
The true ranges of the last five H4 candles are 40, 55, 35, 60 and 50 pips.
| Step | Calculation | Result |
|---|---|---|
| Average (a 5-period ATR, simple average) | (40 + 55 + 35 + 60 + 50) ÷ 5 | 48 pips |
| Stop distance at 1.5 × ATR | 48 × 1.5 | 72 pips |
| Amount a trader chooses to risk | Fixed in advance | $50 |
| Money per pip allowed | $50 ÷ 72 | about $0.69 |
| Position size (about $10 per pip per lot) | 0.69 ÷ 10 = 0.069, rounded down | 0.06 lot |
| Actual risk at 0.06 lot | 72 × $0.60 | about $43 |
The multiplier is a choice, not a rule. A wider stop means a smaller position for the same money at risk; the position size calculator does the arithmetic. A stop fills at the next available price, so in a gap it can fill beyond the stop level.
How do traders use ATR?
Traders use ATR to size stops and positions to current volatility, not to predict which way price will move. A stop set at a multiple of ATR sits outside the normal size of recent candles, and the lot size shrinks as that stop widens, so the money at risk stays the same. The main uses are below.
- Stop distance. A multiple of ATR, such as the 1.5 used above, keeps the stop outside the normal size of recent candles.
- Position size. A wider ATR stop means a smaller lot for the same money at risk, as in the table.
- Direction comes from price. ATR rises in strong falls and strong rises alike, so traders read direction from the chart or a trend tool.
- Compare in money. An ATR of 0.0040 on EURUSD and 0.0400 on USDZAR are different amounts; convert both with the pip value calculator.
ATR is one way to measure volatility; Bollinger Bands are another, and the Bollinger Bands and ATR lesson compares them.
How do you find the ATR indicator in MetaTrader 5?
In MetaTrader 5, add ATR from Insert, Indicators, Oscillators, Average True Range, or drag it from the Navigator onto the chart. It draws in its own window below the chart; set the period (14 is common) in its properties. Hovering over the line, or the Data Window (Ctrl+D), shows the current value.
What do traders often get wrong about ATR?
A common mistake is reading a high ATR as a sign that the market is about to fall, when ATR only measures how big candles have been. High readings occur in strong rises and strong falls alike, so direction has to come from price itself, from swing structure or from a trend tool such as a moving average.
Sources
- MetaQuotes, MetaTrader 5 Help: Average True Range, accessed 19 October 2026: true range as the greatest of high − low, previous close − high and previous close − low; ATR as a moving average of true range values that shows the volatility of the market. https://www.metatrader5.com/en/terminal/help/indicators/oscillators/atr
- MetaQuotes, MetaTrader 5 Help: Technical Indicators, accessed 19 October 2026: indicators are added from the Navigator or with Insert, Indicators; settings change through Properties. https://www.metatrader5.com/en/terminal/help/charts_analysis/indicators
Practise what you learned
Open an account to use MetaTrader 5. Start on a demo account before risking real money.
Open Account