
Volatility
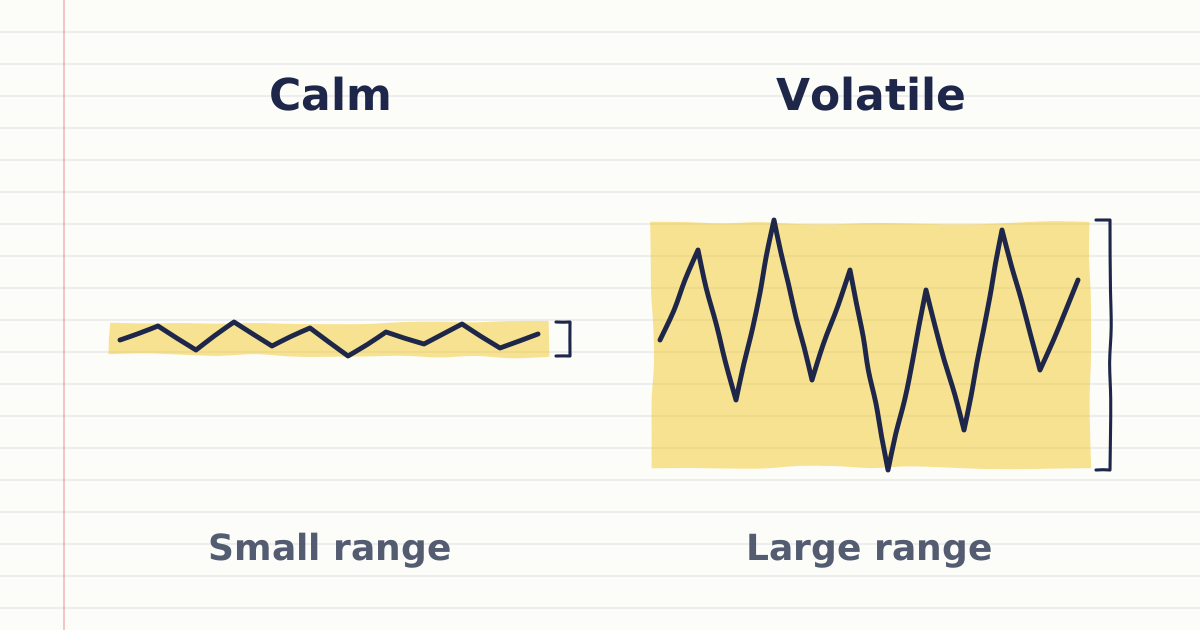
Volatility is how much and how fast a price moves over a period of time; bigger and faster swings mean higher volatility.
Volatility is how much, and how fast, a price moves over a period of time. A market that swings a long way in a day is more volatile than one that drifts a short way. FINRA's investor education page describes it the same way: the more dramatic the swings, the higher the volatility and the potential risk.
What is historical vs implied volatility?
Historical, or realised, volatility looks backwards at past price moves, while implied volatility looks forwards at what option prices expect. Historical volatility is measured from past prices, for example the standard deviation of daily percentage price changes over a month. Implied volatility is the market's expected near-term volatility, extracted from option prices.
Why does volatility matter to a trader?
Volatility matters because it sets how much a position can gain or lose, how far your stop must sit from entry, and how large a position fits your risk. The four effects below are the ones to check before each trade; volatility in forex shows how to adapt them when a pair turns calm or busy.
- Stop distance. Traders set stops wider than the market's usual range, so ordinary movement does not reach them.
- Position size. A wider stop means a smaller position for the same amount at risk. The position size calculator shows the arithmetic.
- Bigger moves both ways. Higher volatility means larger moves in both directions: at the same position size, gains and losses are both bigger.
Worked example: volatility on USDZAR
The daily range is the day's high minus its low on USDZAR.
| Day | High | Low | Daily range |
|---|---|---|---|
| 1 | 18.2400 | 18.0900 | 0.1500 |
| 2 | 18.3200 | 18.1600 | 0.1600 |
| 3 | 18.2800 | 18.1500 | 0.1300 |
| 4 | 18.5000 | 18.2500 | 0.2500 |
| 5 | 18.4600 | 18.2900 | 0.1700 |
The average range is 0.8600 ÷ 5 = 0.1720. On 10,000 US dollars, a move that size is R1,720 either way. In a calmer week averaging 0.1000, it would be R1,000.
Now suppose a trader risks R500 on a stop. With a stop 0.0500 away, the position is 500 ÷ 0.0500 = 10,000 dollars. With a stop 0.1700 away, about one average day, it is 500 ÷ 0.1700, or about 2,900 dollars. An average day here covers over three times 0.0500, so the wider stop with the smaller position fits the market's normal range. If the 0.1700 stop is hit, the loss is about R500 (2,941 × 0.1700); a move of 0.1700 the other way gains about R500.
How do you measure volatility in MetaTrader 5?
MetaTrader 5 shows volatility in the length of each candle and measures it with two built-in indicators, Average True Range and Bollinger Bands. The candlesticks show each period's range, and the OHLC line shows each bar's open, high, low and close.
Average True Range is an oscillator described as showing the volatility of the market, and Bollinger Bands adjust to market conditions because standard deviation is a measure of volatility.
What do traders often get wrong about volatility?
The common mistake is reading high volatility as falling prices, when volatility measures the size of moves, up or down, not their direction. Check the Average True Range in MetaTrader 5 before you set a stop distance, so the stop fits the market's normal range.
Sources
- FINRA, Volatility, accessed 19 October 2026: the more dramatic the swings, the higher the level of volatility and potential risk. https://www.finra.org/investors/investing/investing-basics/volatility
- European Central Bank, Monthly Bulletin, November 2004, Box 3: Recent trends in implied stock market volatility, accessed 19 October 2026: implied volatility is expected near-term volatility extracted from option prices; realised volatility is the standard deviation of daily percentage price changes. https://www.ecb.europa.eu/pub/pdf/other/mb200411_focus03.en.pdf
- MetaQuotes, MetaTrader 5 Help: View and Configure Charts, accessed 19 October 2026: price charts can be shown as Japanese candlesticks. https://www.metatrader5.com/en/terminal/help/charts_analysis/charts
- MetaQuotes, MetaTrader 5 Help: Chart Settings, accessed 19 October 2026: the OHLC line shows open, high, low and close. https://www.metatrader5.com/en/terminal/help/charts_advanced/charts_settings
- MetaQuotes, MetaTrader 5 Help: Average True Range, accessed 19 October 2026: ATR is an indicator that shows volatility of the market. https://www.metatrader5.com/en/terminal/help/indicators/oscillators/atr
- MetaQuotes, MetaTrader 5 Help: Bollinger Bands, accessed 19 October 2026: standard deviation is a measure of volatility, so the bands adjust to market conditions. https://www.metatrader5.com/en/terminal/help/indicators/trend_indicators/bb
Practise what you learned
Open an account to use MetaTrader 5. Start on a demo account before risking real money.
Open Account