
Volatility in Forex: How to Measure It and Adapt to Regimes
Volatility in forex is how far and how fast a currency pair’s price moves over a period, whatever the direction. It runs in regimes, calm or volatile stretches that persist and then shift, and each regime changes the stop distance and position size that carry the same risk.
Module 13 · Lesson 5 of 5
What you'll learn
- What volatility in forex is, and how realised and implied volatility differ.
- How to measure it with ATR, standard deviation and the daily range.
- What a volatility regime is, and what makes one shift.
- How a regime change alters stop distance, position size, slippage and margin.
What is volatility in forex?
Volatility in forex is how far and how fast the price of a currency pair moves over a period, whatever the direction. A pair swinging 120 pips a day is more volatile than one moving 40. Volatility describes the size of moves, not which way they go, so a sharp fall and a sharp rise can read the same.
Definitions
- Volatility regime: a stretch of weeks or months when a pair's typical range stays consistently low or consistently high.
- ATR (average true range): an indicator that averages the size of each candle's true range, in price units.
How do realised and implied volatility differ?
Realised volatility looks backwards at moves that already happened; implied volatility looks forwards, as an expectation priced into options. The European Central Bank describes implied volatility as market participants' expected near-term volatility extracted from option prices, and measures realised volatility as the standard deviation of daily percentage price changes.
| Realised volatility | Implied volatility | |
|---|---|---|
| Looks at | The past | The near future |
| Built from | Past prices | Option prices |
| Where a retail trader sees it | ATR, standard deviation, daily range | Options data, usually outside a CFD platform |
How do you measure volatility in forex?
You measure volatility in forex from past prices, most often with ATR, the standard deviation indicator or the daily high-low range. Each turns recent movement into a number you can compare with the same pair's own history. All three describe the past, which is exactly what stop distances and position sizes are built from.
| Measure | How it is built | What it describes |
|---|---|---|
| Daily range | Day's high − day's low | How far price travelled in one day |
| ATR(14) | Average of the last 14 true ranges | Typical candle size, gaps included |
| Standard deviation | How spread out closes are around their moving average | How far closes stray from their average |
MetaQuotes describes ATR as a moving average of true range values that shows market volatility, and says high standard deviation values mean prices are spread out from their moving average. The step-by-step calculations are in the Bollinger Bands and ATR lesson.
What is a volatility regime?
A volatility regime is a period when a pair's volatility stays consistently low or consistently high for weeks or months, before shifting to a different level. You read it from ATR over months on a daily chart, not from one candle. Traders re-read it as each daily candle closes, because regimes shift.
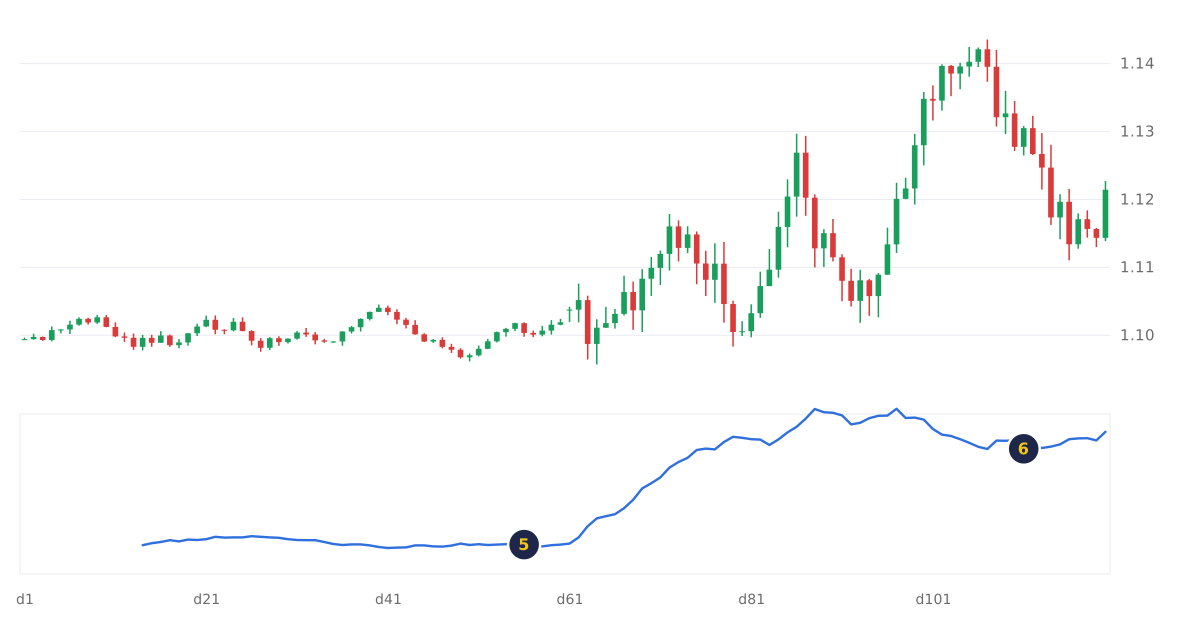
- Marker 5: the calm regime. Small candles, and a low, flat ATR for about 60 days.
- Marker 6: after the shift, ATR rises to several times its calm level and stays there.
Price moved both ways in the volatile stretch, because volatility measures the size of moves, not their direction.
What causes market volatility to change?
Market volatility changes when the flow of information or the number of active traders changes. Common drivers are scheduled news, central bank policy decisions, unexpected shocks and the time of day. A regime can shift in one day after a surprise, or build slowly as conditions change.
- News: major releases can move price far within minutes.
- Policy: a new central bank path can change how a currency trades for months.
- Shocks: wars or crises can lift volatility across many pairs at once.
- Sessions and liquidity: in thin hours, each trade can move price further.
The Bank for International Settlements (BIS) studied the sterling "flash event" of 7 October 2016. It found that GBP/USD volumes and liquidity drop off particularly during the early hours of Asian trading, and that the time of day played a significant role in a move with no single driver. It adds that such events often happen in quiet hours, when liquidity is thinnest.
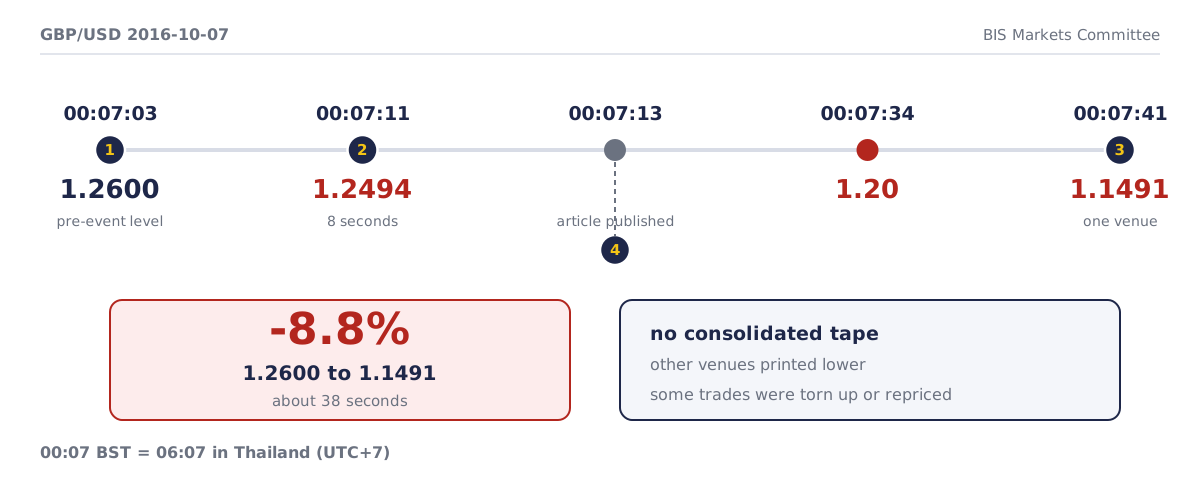
- Markers 1 and 2: GBP/USD fell from 1.2600 at 00:07:03 to 1.2494 at 00:07:11 UK summer time, in about eight seconds.
- Marker 3: past 1.20 at 00:07:34; at 00:07:41, trades as low as 1.1491 on one venue, almost 9% below 1.26.
- Marker 4: a Financial Times article was published at 00:07:13, after the fall had already begun.
- FX has no consolidated tape, so other venues printed lower, and some trades were later torn up or repriced.
00:07 UK summer time was 23:07 UTC, which is 00:07 at UTC+1 and 07:07 at UTC+8.
How does a volatility regime change position size?
When volatility rises, a stop set outside normal movement must be wider, so the position must be smaller to keep the same money at risk. If you keep the old size with a wider stop, your risk has grown; if you keep the old stop, ordinary movement can reach it.
Synthetic example: you risk $50 per trade, use a stop of 1.5 × ATR(14), and a pip on this USD-quoted pair is worth $10 per lot in a USD account. The 1.5 multiple is this example's rule; traders test their own.
- Calm regime: ATR is 40 pips, so the stop is 60 pips. Size = $50 ÷ (60 × $10) = 0.0833, rounded down to 0.08 lot.
- Volatile regime: ATR is 120 pips, so the stop is 180 pips. Size = $50 ÷ (180 × $10) = 0.0278, rounded down to 0.02 lot.
- Check: 0.08 × 60 × $10 = $48 and 0.02 × 180 × $10 = $36, both under $50.
| Calm regime | Volatile regime | |
|---|---|---|
| ATR(14) | 40 pips | 120 pips |
| ATR as % of price (pair at 1.0850) | 0.37% | 1.11% |
| Stop (1.5 × ATR) | 60 pips | 180 pips |
| Position size (rounded down) | 0.08 lot | 0.02 lot |
| Loss if the stop is hit | $48 | $36 |
| Margin at an assumed 1:30 | $289.33 | $72.33 |
| Spreads and slippage | Usually narrower and smaller | Often wider and larger |
Margin falls with size: 0.08 lot at 1.0850 is an $8,680 position, 0.02 lot is $2,170.
In any account currency the sizes stay 0.08 and 0.
The position sizing lesson explains the formula, and the position size calculator runs it. See also our guide to forex lot sizes.
Which are the most volatile forex pairs?
The most volatile forex pairs are the ones with the highest ATR as a percentage of price over the period you measure, and the ranking changes over time. A pair can be calm for a year and then become one of the busiest after a policy change or a shock.
The BIS records one such shock in USD/ZAR: at 22:10 UK time (22:10 UTC) on 10 January 2016, the rand fell about 8% in 10 minutes and recovered 75% of the fall within four hours.
To compare pairs fairly, use ATR as a percentage of price: ATR ÷ price × 100. Pips alone mislead, because a pip is a different share of price on each pair.
| Illustrative pair | Price | ATR(14) | ATR as % of price |
|---|---|---|---|
| A pair quoted to 4 decimals | 1.0850 | 0.0040 (40 pips) | 0.37% |
| A pair quoted to 2 decimals | 150.00 | 1.20 (120 pips) | 0.80% |
| A pair quoted near 18 | 18.0000 | 0.2500 | 1.39% |
The figures are synthetic, to show the method.
How do traders manage risk in volatile markets?
Traders manage volatile markets by widening stops to match ATR, cutting position size to keep the same money at risk, and allowing for wider spreads and slippage. In a volatile regime, stops can fill at worse prices and positions move further before you react, so the size is set for that.
- Slippage and gaps: in the sterling event, the BIS saw spreads widen sharply and prices gap, so size leaves room for a fill past the stop. See the news, gaps and slippage lesson.
- Thin hours: the forex market sessions lesson shows when liquidity is usually lower, so you know which hours move most on little volume.
- Margin: a fast move can use up free margin quickly, so smaller size also keeps free margin in reserve; margin calls and stop-outs are covered in Module 5, Risk Management.
- Lag: ATR reacts only after candles form, so a shift shows up late; checking it daily keeps sizes current.
Try it on demo
On a MetaTrader 5 demo account, open a daily chart and add ATR(14) (Insert, Indicators, Oscillators). Scroll back two years and mark the calmest and busiest stretches. Size the same $50 risk with a 1.5 × ATR stop in each and compare the lots.
This lesson is part of the Advanced Trading Strategies module.
Quick check
- Realised volatility is
- ATR(14) rises from 40 pips to 120 pips. With a 1.5 × ATR stop, the stop distance becomes
- You risk $50, the stop is 180 pips and a pip is worth $10 per lot. Rounded down, the position size is
- Why compare ATR as a percentage of price rather than in pips?
- A high ATR tells you
Frequently asked questions
Is high volatility good or bad for trading?
It changes the arithmetic: bigger moves mean wider stops, smaller positions for the same risk, wider spreads and more slippage. Traders trade both regimes by resizing for the one they are in.
When is the forex market most active?
The BIS found GBP/USD activity and liquidity highest when London and New York are open, around 7 to 9 am and 1 to 5 pm UK time. Volumes and liquidity drop off outside these hours, particularly in early Asian trading. Other pairs follow their own markets' hours.
What is the best indicator for forex volatility?
For stops and position sizing, ATR fits best, because it measures typical candle size in price units. ATR shows typical candle size, gaps included; standard deviation shows how far closes stray from their average; Bollinger Band width shows that spread on the chart. All three are built into MetaTrader 5.
Does volatility show which way price will move?
No. Volatility measures how far price moves, not the direction. A high ATR can come from a sharp fall, a sharp rise or both.
Sources
- Bank for International Settlements, Markets Committee, The sterling 'flash event' of 7 October 2016, January 2017: GBP/USD fell from 1.2600 to 1.2494 between 00:07:03 and 00:07:11 BST; the FT article was published at 00:07:13; 1.20 by 00:07:34; trades as low as 1.1491 on Reuters at 00:07:41, almost 9% below 1.26, with lower prices on other platforms; FX lacks a consolidated tape; some trades were torn up or repriced; spot spreads widened; flash events often occur in quiet hours when liquidity is thinnest; USD/ZAR on 10 January 2016 at 22:10 UK time (00:10 local), a fall of about 8% in the rand in 10 minutes, 75% recovered within four hours and price gapping appeared; activity is highest around 7–9 am and 1–5 pm UK time and volumes and liquidity drop off particularly in early Asian trading; a confluence of factors, with time of day playing a significant role. https://www.bis.org/publications/sterling-flash-event-7-october-2016.pdf
- European Central Bank, Monthly Bulletin, Box 3: Recent trends in implied stock market volatility, November 2004: implied volatility is market participants' expected near-term volatility extracted from option prices; realised volatility is calculated as the standard deviation of daily percentage price changes; the two show a high degree of co-movement, though implied volatility under-predicted realised volatility from March to October 2002. https://www.ecb.europa.eu/pub/pdf/other/mb200411_focus03.en.pdf
- MetaQuotes, MetaTrader 5 Help: Average True Range (accessed 27 October 2026): true range is the greatest of high − low, previous close − high and previous close − low; ATR is a moving average of true range values that shows market volatility. https://www.metatrader5.com/en/terminal/help/indicators/oscillators/atr
- MetaQuotes, MetaTrader 5 Help: Standard Deviation (accessed 27 October 2026): a measure of market volatility based on the spread of prices around a moving average; high values mean prices are spread out from the moving average and low values mean low volatility. https://www.metatrader5.com/en/terminal/help/indicators/trend_indicators/sd
Practise what you learned
Open an account to use MetaTrader 5. Start on a demo account before risking real money.
Open Account