
Risk On Risk Off: What It Means in Forex and Markets
Risk on and risk off describe whether investors are moving money toward riskier assets, such as shares, or toward assets seen as safer, such as the yen. The labels describe flows across many markets at once, and in a severe shock even safe havens can be sold for cash, as in March 2020.
Module 12 · Lesson 2 of 5
What you'll learn
- What risk on and risk off mean, and how a regime is read.
- Which currencies and assets tend to rise or fall in each.
- How a risk-off day can hit two positions that share no currency.
- Why the usual pattern broke in March 2020.
What does risk on risk off mean?
Risk on and risk off describe which way money is moving between assets investors buy to grow and assets they hold for safety. In risk on, money tends to flow toward shares and higher-yielding currencies. In risk off, it tends to flow toward assets seen as safer, such as the Japanese yen, Swiss franc, US dollar and government bonds.
The labels describe how money has been flowing across many markets. You met risk sentiment in the Beginner lesson on what moves the forex market; this lesson, part of the Global Macro module, looks at how it moves several currency pairs together.
Key terms
- Risk sentiment: how much risk investors are willing to take at a given time.
- Safe-haven asset: an asset investors tend to buy when fear rises, such as the yen or government bonds. See safe haven meaning.
- Higher-yielding currency: a currency whose deposits pay a relatively high interest rate.
- Sentiment regime: a stretch of time in which risk on or risk off dominates, read across several markets.
What does risk off mean?
Risk off means investors are selling riskier assets and moving money into assets they see as safer. Share prices tend to fall, higher-yielding and commodity currencies tend to weaken, and safe-haven currencies tend to strengthen. The Financial Stability Board described this phase in early 2020 as a "flight to safety", when investors sold riskier assets and bought less risky ones.
Risk on is the reverse, and a regime can last weeks or flip within a day.
Which assets tend to rise or fall in risk on and risk off?
In risk off, the yen, the Swiss franc and the US dollar have tended to strengthen, while commodity and emerging-market currencies have tended to weaken. An IMF working paper found that in risk-off episodes the yen, Swiss franc and US dollar appreciate against other G-10 and emerging-market currencies.
The Reserve Bank of Australia says the Australian dollar tracks changes in risk sentiment, typically rising when global share prices rise and falling when they fall.
| Asset group | Examples | Risk on: tends to | Risk off: tends to |
|---|---|---|---|
| Shares and stock indices | US 500, other major indices | Rise | Fall |
| Commodity currencies | Australian dollar (AUD), New Zealand dollar (NZD) | Strengthen | Weaken |
| Emerging-market currencies | Currencies of fast-growing, higher-yielding economies | Strengthen | Weaken |
| Safe-haven currencies | Japanese yen (JPY), Swiss franc (CHF), often the US dollar (USD) | Weaken | Strengthen |
| Government bonds | US Treasuries | Often fall | Often rise |
| Gold | XAUUSD | Mixed | Often rises; sold for cash in March 2020 |
These are the tendencies seen in past episodes. Why AUD and NZD are grouped together is covered in the commodity currencies lesson.
What makes markets switch between risk on and risk off?
Markets switch when news changes how investors see growth and danger, so the same assets get bought or sold together. The trigger is usually a surprise: weaker growth data than expected, a sudden shock such as a pandemic or conflict, or a central bank action that changes the outlook for interest rates or for funding.
The FSB noted that the most acute 2020 stress lasted until major central bank interventions.
Why does the yen often strengthen in risk off?
One reason the yen often strengthens in risk off is the carry trade: borrowing a low-interest currency to invest in higher-yielding ones. Low Japanese rates have made the yen a common funding currency. When fear rises, traders close these positions and buy back the yen they borrowed, which can push it up quickly.
The Bank for International Settlements (BIS) described this in August 2024: after a disappointing US labour market report on 2 August, carry trades unwound and the yen appreciated sharply. On 5 August Japan's TOPIX index posted double-digit losses, and the VIX briefly exceeded 60 before closing under 40. Prices recovered in under a week.
How do traders measure risk sentiment?
Traders measure risk sentiment by watching several markets together, such as stock indices, volatility indices, credit spreads and safe-haven currencies. No single number defines a regime, so traders read the measures together and look for them to agree. The table lists four common measures and the limit of each.
| Measure | How it is built | What it describes | Limit |
|---|---|---|---|
| Stock indices | A weighted basket of share prices | Appetite for company risk | Can move on one sector |
| Volatility index (VIX) | Built by Cboe from S&P 500 option prices | Expected near-term volatility in US shares | Measures how big moves may be, not their direction |
| Credit spreads | Extra yield on company bonds over government bonds | Reward lenders demand for default risk | Less visible than prices |
| AUDJPY, USDJPY | Exchange rates on your platform | A growth currency against a haven | Each pair also moves on its own news |
Traders often read a rising VIX, falling stocks and a stronger yen together as risk off. See volatility in the glossary.
How does a risk-off day affect two positions at once?
A risk-off day can hit two positions that share no currency, because both can be the same bet on risk sentiment. Long AUDJPY is long a growth currency against a haven. Long EURUSD is short the US dollar, which often strengthens in risk off. Your combined result is each pip move × pip value, added together.
Worked example: AUDJPY and EURUSD
Synthetic figures: you hold long 0.10 lot of AUDJPY and long 0.10 lot of EURUSD.
- EURUSD: 0.10 lot of a pair quoted in US dollars is $1 per pip.
- AUDJPY: 0.10 lot is 10,000 AUD, so one pip (0.01 yen) is 100 yen. At an assumed USDJPY of 150.00, that is 100 ÷ 150 ≈ $0.67 per pip.
Pip values are explained in lots, pips and pip value; check yours with the pip value calculator.
| Scenario | AUDJPY | EURUSD | Combined |
|---|---|---|---|
| Risk-off day, dollar strengthens | −120 pips = −$80 | −40 pips = −$40 | −$120 |
| Risk-on day, the reverse | +120 pips = +$80 | +40 pips = +$40 | +$120 |
| Risk-off day, dollar weakens instead | −120 pips = −$80 | +40 pips = +$40 | −$40 |
The AUDJPY figure is 120 × 100 yen = 12,000 yen ÷ 150 = $80. If the yen also strengthens and USDJPY falls to 145, the same 12,000 yen is about $82.76: the loss is counted in the currency that is gaining.
The two trades behave like one larger position, the portfolio heat idea from forex pair correlation.
How did risk off play out in March 2020?
March 2020 began as a textbook risk-off move and then turned into a "dash for cash", when even safe havens were sold. The FSB's review of the March market turmoil records that on 16 March the S&P 500 lost 12%, its worst day since 1987, and the VIX reached its all-time peak of 83.
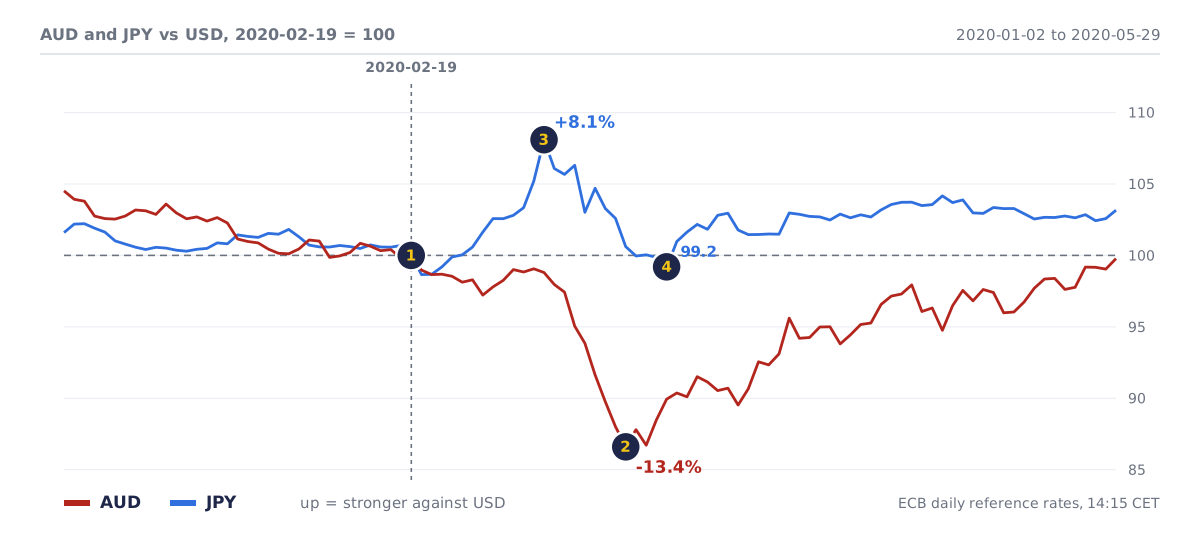
- Both currencies start at 100 on 19 February 2020.
- The Australian dollar falls 13.4% against the US dollar by 19 March.
- The yen strengthens about 8.1% into 9 March, the usual haven response.
- By 25 March the yen is back below its starting level, at 99.2.
The chart is derived from the ECB's euro reference rates, a once-a-day snapshot rather than traded prices.
The FSB explains why havens failed: investors sold government bonds and gold, which had gained in value, to raise cash. The dollar rose sharply as non-US firms sought dollars, and a BIS Bulletin found dollar funding costs rose sharply, then eased after central banks deployed dollar swap lines.
How do skilled traders manage risk-on and risk-off exposure?
Skilled traders count positions that share a sentiment bet as one, check how havens are behaving in each episode, and size for the case where usual offsets move together. The FSB wrote that longstanding price relationships across markets began to break down in March 2020, when assets that normally move apart fell at the same time.
- Check the haven each time. A haven that held last month can be sold for cash this week, as gold was in March 2020.
- Count shared bets once. Different pairs can carry the same sentiment bet, so add their risk together.
- Budget for wider costs. Spreads widen and prices gap in stress.
- Read the regime early. By the time a regime is obvious, much of the move is usually already in the price.
Try it on demo
On a MetaTrader 5 demo account, open D1 charts of AUDJPY, EURUSD, USDJPY and gold side by side. Scroll back to February and March 2020, if your broker's history goes that far, and note the date each turned. Then open 0.10 lot each of AUDJPY and EURUSD and watch their combined result in the Trade tab.
Quick check
- In a risk-off episode, money tends to move toward
- Which currencies did an IMF study find tend to strengthen in risk-off episodes?
- You are long 0.10 lot AUDJPY (about $0.67 per pip) and long 0.10 lot EURUSD ($1 per pip). AUDJPY falls 120 pips and EURUSD falls 40 pips. The combined result is
- In March 2020 gold was sold during the dash for cash mainly because
- One reason the yen often strengthens in risk off is
Frequently asked questions
Is the US dollar risk on or risk off?
The US dollar has usually behaved as a risk-off currency, tending to strengthen when fear rises, as it did in March 2020. It can still weaken in risk off, for example when the shock starts in the US.
Is gold a risk-off asset?
Gold is widely treated as a safe haven and often rises in risk off. In the March 2020 dash for cash it was sold too, because it had gained in value and was an easy source of cash.
What are risk-on currencies?
Risk-on currencies are ones that have tended to strengthen when investors are confident, such as the Australian and New Zealand dollars and many emerging-market currencies.
What is a risk-off currency?
A risk-off currency is one that has tended to strengthen when investors grow fearful, such as the Japanese yen, Swiss franc and US dollar. An IMF study found these three appreciate against other G-10 and emerging-market currencies in risk-off episodes.
Sources
- International Monetary Fund (IMF), The Behavior of Currencies during Risk-off Episodes, Working Paper by Reinout De Bock and Irineu de Carvalho Filho, 11 January 2013: in risk-off episodes the Japanese yen, Swiss franc and US dollar appreciate against other G-10 and emerging-market currencies. https://www.imf.org/en/Publications/WP/Issues/2016/12/31/The-Behavior-of-Currencies-during-Risk-off-Episodes-40233
- Reserve Bank of Australia, Drivers of the Australian Dollar Exchange Rate (education explainer) (accessed 27 October 2026): the Australian dollar tracks changes in risk sentiment, typically appreciating when global equity prices rise and depreciating when they fall. https://www.rba.gov.au/education/resources/explainers/drivers-of-the-aud-exchange-rate.html
- Financial Stability Board (FSB), Holistic Review of the March Market Turmoil, 17 November 2020: the flight-to-safety and dash-for-cash phases; on 16 March the S&P 500 lost 12% and the VIX reached its all-time peak of 83; longstanding price relationships broke down; government bonds and gold were sold to raise cash; the US dollar appreciated considerably; the stress lasted until central bank interventions. https://www.fsb.org/uploads/P171120-2.pdf
- Bank for International Settlements (BIS), Dollar funding costs during the Covid-19 crisis through the lens of the FX swap market, BIS Bulletin No 1, 1 April 2020: dollar funding costs rose sharply and narrowed after central banks deployed dollar swap lines. https://www.bis.org/publ/bisbull01.htm
- Bank for International Settlements (BIS), Carry off, carry on, BIS Quarterly Review, 16 September 2024: carry trades borrow in low-interest currencies to invest in higher-yielding ones; low yen rates made it a funding currency of choice; after the 2 August US labour market release carry trades unwound and the yen appreciated sharply; on 5 August the TOPIX posted double-digit losses; the VIX briefly exceeded 60 before closing under 40; prices recovered in less than a week. https://www.bis.org/publ/qtrpdf/r_qt2409a.htm
- Cboe, VIX Index (accessed 27 October 2026): the VIX is a measure of market expectations of near-term volatility conveyed by S&P 500 option prices. https://www.cboe.com/tradable_products/vix/
- European Central Bank (ECB), Euro foreign exchange reference rates: daily reference rates published for information purposes only; source data for the AUD and JPY chart (USD cross rates derived from the AUD, JPY and USD euro rates, 2 January to 29 May 2020). https://www.ecb.europa.eu/stats/policy_and_exchange_rates/euro_reference_exchange_rates/html/index.en.html
Practise what you learned
Open an account to use MetaTrader 5. Start on a demo account before risking real money.
Open Account