
Correlated Forex Pairs: List, Correlation Table and Risk
Forex pair correlation is a number from −1 to +1 that describes how closely two currency pairs have moved together in the past. Two positions in highly correlated pairs can act like one larger position, so their risks add up.
Module 10 · Lesson 3 of 5
What you'll learn
- Which forex pairs are correlated, with a 1-year table for eight dollar pairs.
- What forex pair correlation is and how to read a coefficient from −1 to +1.
- How the coefficient is calculated, and how to read a correlation table.
- Why two trades in correlated pairs can act like one larger position.
- How to add up portfolio heat and check pairs side by side in MetaTrader 5.
What is forex pair correlation?
Forex pair correlation is a measure of how closely two currency pairs have moved together over a chosen period. It is written as a coefficient from −1 to +1. Near +1, the pairs have tended to rise and fall together. Near −1, they have tended to move in opposite directions. Near 0, there has been no reliable link.
In this lesson, part of the Trade Management module, correlation is a risk tool: it tells you whether your open trades are separate bets or one bet placed twice. Correlation is also one of the checks used when choosing the best forex pairs to trade.
Key terms
- Correlation coefficient: the number from −1 to +1 that summarises how two price series moved together.
- Return: the percentage change in price from one period to the next, such as one day.
- Portfolio heat: the total amount you would lose if every open position hit its stop loss.
Why do currency pairs move together?
Currency pairs move together mainly because many of them share a currency, so one move in that currency pushes several pairs at once. EURUSD and GBPUSD both have the US dollar as the quote currency. When the dollar strengthens broadly, both pairs tend to fall; when it weakens, both tend to rise.
The Bank for International Settlements found in its 2025 Triennial Survey that the US dollar was on one side of 89.2% of all foreign exchange trades. So many pairs you might trade carry the same dollar exposure.
News that moves one currency, such as a central bank decision, can move every pair that contains it, as the central banks and currencies lesson explains.
Which forex pairs are correlated?
The most correlated forex pairs are those that share the US dollar on the same side: over the year to 23 October 2026, EURUSD and GBPUSD had a daily correlation of +0.84 and AUDUSD and NZDUSD +0.80, while EURUSD and USDCHF, with the dollar on opposite sides, were the most negatively correlated at −0.83.
Correlated forex pairs list, ranked from 28 pair combinations of eight dollar pairs:
| Most positively correlated | 1 year | Most negatively correlated | 1 year |
|---|---|---|---|
| EURUSD and GBPUSD | +0.84 | EURUSD and USDCHF | −0.83 |
| AUDUSD and NZDUSD | +0.80 | AUDUSD and USDZAR | −0.77 |
| EURUSD and NZDUSD | +0.75 | NZDUSD and USDCHF | −0.74 |
| GBPUSD and NZDUSD | +0.74 | GBPUSD and USDCHF | −0.73 |
| GBPUSD and AUDUSD | +0.73 | GBPUSD and USDZAR | −0.71 |
The weakest links were USDJPY with USDZAR (+0.29), AUDUSD with USDJPY (−0.31) and USDCAD with USDJPY (+0.36). The yen often moves on its own drivers, so USDJPY had the loosest link to the other dollar pairs.
Forex correlation table, daily returns, 24 October 2025 to 23 October 2026 (254 trading days):
| EURUSD | GBPUSD | AUDUSD | NZDUSD | USDCAD | USDCHF | USDJPY | USDZAR | |
|---|---|---|---|---|---|---|---|---|
| EURUSD | 1.00 | 0.84 | 0.69 | 0.75 | −0.61 | −0.83 | −0.55 | −0.70 |
| GBPUSD | 0.84 | 1.00 | 0.73 | 0.74 | −0.59 | −0.73 | −0.47 | −0.71 |
| AUDUSD | 0.69 | 0.73 | 1.00 | 0.80 | −0.59 | −0.59 | −0.31 | −0.77 |
| NZDUSD | 0.75 | 0.74 | 0.80 | 1.00 | −0.65 | −0.74 | −0.43 | −0.65 |
| USDCAD | −0.61 | −0.59 | −0.59 | −0.65 | 1.00 | 0.60 | 0.36 | 0.41 |
| USDCHF | −0.83 | −0.73 | −0.59 | −0.74 | 0.60 | 1.00 | 0.57 | 0.53 |
| USDJPY | −0.55 | −0.47 | −0.31 | −0.43 | 0.36 | 0.57 | 1.00 | 0.29 |
| USDZAR | −0.70 | −0.71 | −0.77 | −0.65 | 0.41 | 0.53 | 0.29 | 1.00 |
How the table was made. KCM Academy computed it from the European Central Bank's daily euro reference rates: each dollar pair is derived from two euro rates (GBPUSD = EUR/USD ÷ EUR/GBP, for example), and the coefficient is the Pearson correlation of daily log returns, the method shown in the next section. The ECB rates are a once-a-day snapshot taken at 14:15 Frankfurt time, so a table built from your broker's closing prices or another time of day will differ slightly. It describes the past year, not the next one.
The pattern follows the shared currency. Pairs with the dollar as the quote currency (EURUSD, GBPUSD, AUDUSD, NZDUSD) rise together when the dollar weakens, so they correlate positively with each other. Pairs with the dollar as the base currency (USDCAD, USDCHF, USDJPY, USDZAR) move the other way, so every cross between the two groups is negative.
Correlations change. Over the last three months of the same data (28 July to 23 October 2026), EURUSD and USDCHF weakened from −0.83 to −0.60 and EURUSD and AUDUSD from +0.69 to +0.52, while EURUSD and GBPUSD held at +0.85. Recheck the figure for the period you trade. Commodity currencies such as AUD, NZD and CAD also follow metals and oil prices, as commodity currencies explains.
How do you calculate a correlation coefficient?
The usual correlation coefficient, called Pearson's r, compares how two series of returns moved away from their own averages over the same window. You take each pair's daily returns, subtract each pair's average, multiply the matching gaps day by day, add them up, and divide by a scaling figure so the result always lands between −1 and +1.
In words, the formula is:
r = sum of (EURUSD gap × GBPUSD gap) ÷ square root of (sum of EURUSD gaps squared × sum of GBPUSD gaps squared)
A "gap" is one day's return minus that pair's average return. Use the same dates and timeframe for both pairs.
Worked example: a 5-day correlation
These daily returns are synthetic, chosen to keep the arithmetic simple. Both series average 0%, so each gap equals the return itself.
| Day | EURUSD return | GBPUSD return | EURUSD × GBPUSD | EURUSD squared | GBPUSD squared |
|---|---|---|---|---|---|
| 1 | +0.3% | +0.2% | 0.06 | 0.09 | 0.04 |
| 2 | −0.2% | −0.3% | 0.06 | 0.04 | 0.09 |
| 3 | +0.4% | +0.3% | 0.12 | 0.16 | 0.09 |
| 4 | −0.4% | −0.2% | 0.08 | 0.16 | 0.04 |
| 5 | −0.1% | 0.0% | 0.00 | 0.01 | 0.00 |
| Sum | 0.0% | 0.0% | 0.32 | 0.46 | 0.26 |
- 0.46 × 0.26 = 0.1196
- Square root of 0.1196 ≈ 0.3458
- r = 0.32 ÷ 0.3458 ≈ +0.93
Five days keeps the arithmetic short; real tables use longer windows, and each window gives its own number.
How do you read a forex correlation table?
A forex correlation table, or matrix, lists currency pairs across the top and down the side, and each cell shows the coefficient for those two pairs over a stated period. Many online tables show it as a percentage from −100% to +100%, which is the coefficient × 100. Check the timeframe and period before reading any cell.
| Coefficient | As a percentage | How traders often describe it |
|---|---|---|
| +0.7 to +1 | +70% to +100% | Strong positive: usually moved together |
| +0.3 to +0.7 | +30% to +70% | Moderate positive |
| −0.3 to +0.3 | −30% to +30% | Weak or no reliable link |
| −0.7 to −0.3 | −70% to −30% | Moderate negative |
| −1 to −0.7 | −100% to −70% | Strong negative: usually moved in opposite directions |
These bands are a convention, not a standard. The same pairs can look strong on hourly data and weak on daily data, or differ between a 20-day and a 1-year window.
How does correlation change your real risk?
Two positions in highly correlated pairs can act like one larger position, because the move that hits one stop loss tends to hit the other at the same time. Your total risk is then the sum of both risks, not the risk of either trade alone. This total is called portfolio heat.
Worked example: two correlated trades
You have a $3,000 account. You plan each trade with position sizing so that a stop-out costs 1%, or $30.
| Position | Size | Stop distance | Pip value | Risk if stopped |
|---|---|---|---|---|
| Long EURUSD | 0.10 lot | 30 pips | $1 | $30 (1%) |
| Long GBPUSD | 0.10 lot | 30 pips | $1 | $30 (1%) |
| Portfolio heat | $60 (2%) |
Each 0.10 lot of a pair quoted in US dollars is worth about $1 per pip, as the lots, pips and pip value lesson explains. So 30 pips × $1 = $30 per trade, $30 + $30 = $60, and $60 ÷ $3,000 = 2%.
Both trades are long against the dollar. With a correlation near +0.9, a broad dollar rally tends to push both toward their stops together. You are close to holding one 0.20 lot position: 30 pips × $2 per pip = $60.
To keep the combined total within a limit you set, size each trade with the position size calculator and add the results.
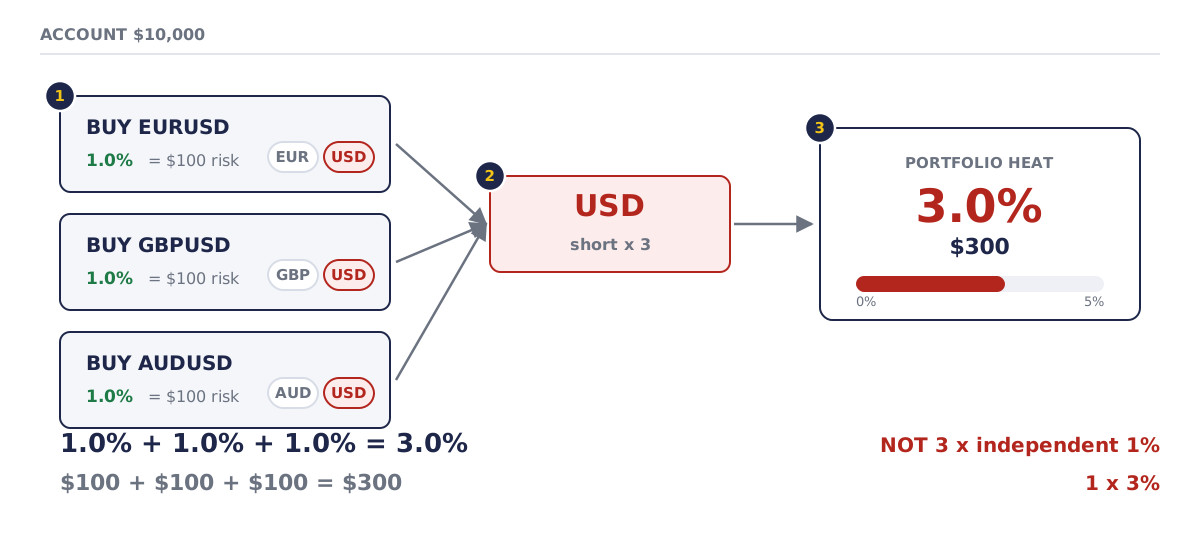
- Three positions, each risking 1% of a $10,000 account, or $100.
- All three are short the US dollar.
- Portfolio heat is $300, or 3%: one dollar bet, not three separate 1% bets.
How do you use correlation to manage risk?
Use correlation to cap your total risk: add up the risk on every open position that shares a currency, and keep that total, your portfolio heat, inside a limit you set. Skilled traders size each new trade to fit under that cap and recheck the correlation figure regularly, because a 20-day figure can differ a lot from a 1-year figure.
- Recheck around news. Around major news or a market shock, links can strengthen, weaken or flip sign quickly.
- Size opposite positions separately. A negative correlation describes how two pairs moved, so each position still carries its own risk to its own stop.
- Watch shared margin. Correlated positions draw on the same account margin, so their moves count together towards your margin level and stop-out, as margin call and stop-out explains.
- Use it as a risk measure. Correlation describes how prices moved together, which is exactly what you need to add up risk across open trades.
How do you check correlation in MetaTrader 5?
To check correlation in MetaTrader 5, open the charts of both pairs on the same timeframe and arrange them side by side, then compare their swings over the same dates. The MetaTrader 5 help on charts explains that you can open up to 100 charts and arrange them from the Window menu.
That page does not describe a built-in correlation tool. For a number, put both pairs' closing prices into a spreadsheet and apply the formula above.
Try it on demo
On a MetaTrader 5 demo account, open daily charts of EURUSD, GBPUSD and USDCHF side by side and note which days each rose or fell over two weeks. Then open two small demo trades and add up the money at risk on both stops: that is your portfolio heat.
Quick check
- A correlation of −0.9 between two pairs means they have
- Why do EURUSD and GBPUSD often move in the same direction?
- You hold long 0.10 lot EURUSD and long 0.10 lot GBPUSD, each with a 30-pip stop at $1 per pip. Your portfolio heat is
- On a $3,000 account, $60 of combined risk is
- A correlation figure measured over the last year
Frequently asked questions
Which forex pairs are most correlated?
Pairs that share a currency on the same side. Over the year to 23 October 2026, EURUSD and GBPUSD were the most positively correlated of eight dollar pairs at +0.84, followed by AUDUSD and NZDUSD at +0.80. EURUSD and USDCHF were the most negatively correlated at −0.83. The strength of each link changes over time.
Which forex pairs are not correlated?
Pairs with no currency in common, such as EURUSD and AUDJPY, often show a weak or shifting link. Among the dollar pairs, USDJPY had the loosest links over the year to October 2026, for example +0.29 with USDZAR. A low figure today can still rise later.
Can you hedge with negatively correlated pairs?
Opposite positions in negatively correlated pairs can offset part of each other's moves while the link holds. The link can weaken or flip, and both positions carry their own costs, so size each one as a separate risk. Opening two positions on the same symbol is covered in the netting vs hedging lesson.
Is currency correlation the same as forex correlation?
Yes. In everyday use both terms mean how closely two currency pairs have moved together, measured from −1 to +1.
Sources
- Bank for International Settlements (BIS), OTC foreign exchange turnover in April 2025 (Triennial Central Bank Survey), 30 September 2025: the US dollar was on one side of 89.2% of all foreign exchange trades. https://www.bis.org/publications/202509-commentary-otc-derivatives
- European Central Bank, Euro foreign exchange reference rates, daily series, downloaded 26 October 2026 (data to 23 October 2026): reference rates of the euro against USD, GBP, AUD, NZD, CAD, CHF, JPY and ZAR, set at about 14:15 CET; the correlation table and list in this lesson are KCM Academy's calculation from these rates (Pearson correlation of daily log returns, 24 October 2025 to 23 October 2026, and 28 July to 23 October 2026). https://www.ecb.europa.eu/stats/policy_and_exchange_rates/euro_reference_exchange_rates/html/index.en.html
- MetaQuotes, MetaTrader 5 Help: View and Configure Charts, accessed 19 October 2026: up to 100 charts can be open at a time, and charts are arranged from the Window menu. https://www.metatrader5.com/en/terminal/help/charts_analysis/charts
Practise what you learned
Open an account to use MetaTrader 5. Start on a demo account before risking real money.
Open Account