
Forex Indicators: Moving Averages, RSI, MACD and More
Module 7
Lessons in this module
- 1Moving averages8 min
A moving average is the average closing price of the last N candles, recalculated as each new candle closes and drawn as one smooth line on your chart. It smooths out noise so the direction of recent price is easy to see, at the cost of some lag behind the latest close.
- 2RSI and Stochastic8 min
RSI, the Relative Strength Index, is a momentum oscillator that compares the size of recent gains with recent losses on a 0 to 100 scale. A reading above 70 shows strong recent buying force, and in a strong trend RSI can hold above 70 for long stretches.
- 3MACD indicator8 min
MACD (Moving Average Convergence/Divergence) is an indicator that measures the gap between a 12-period and a 26-period exponential moving average of price. Traders read it through crossovers, the zero line and divergence to judge the direction and strength of momentum.
- 4Bollinger Bands and ATR8 min
Bollinger Bands are a 20-period simple moving average with lines two standard deviations above and below it, so they widen when prices swing more and narrow in calm markets. The ATR indicator puts the same volatility into one number, which traders use to set stop distance and position size.
- 5Combining indicators8 min
The best indicators to use together each do a different job, such as a trend tool plus a volatility tool, rather than several tools that measure the same thing. RSI and stochastic both reading overbought is one piece of information, not two.
About this module
Forex indicators are calculations applied to past prices, such as an average of recent closes, and drawn on the chart to describe trend, momentum or volatility. Each turns data you already see into a cleaner reading, but because indicators are built from past candles, each has a built-in lag that traders learn to read.
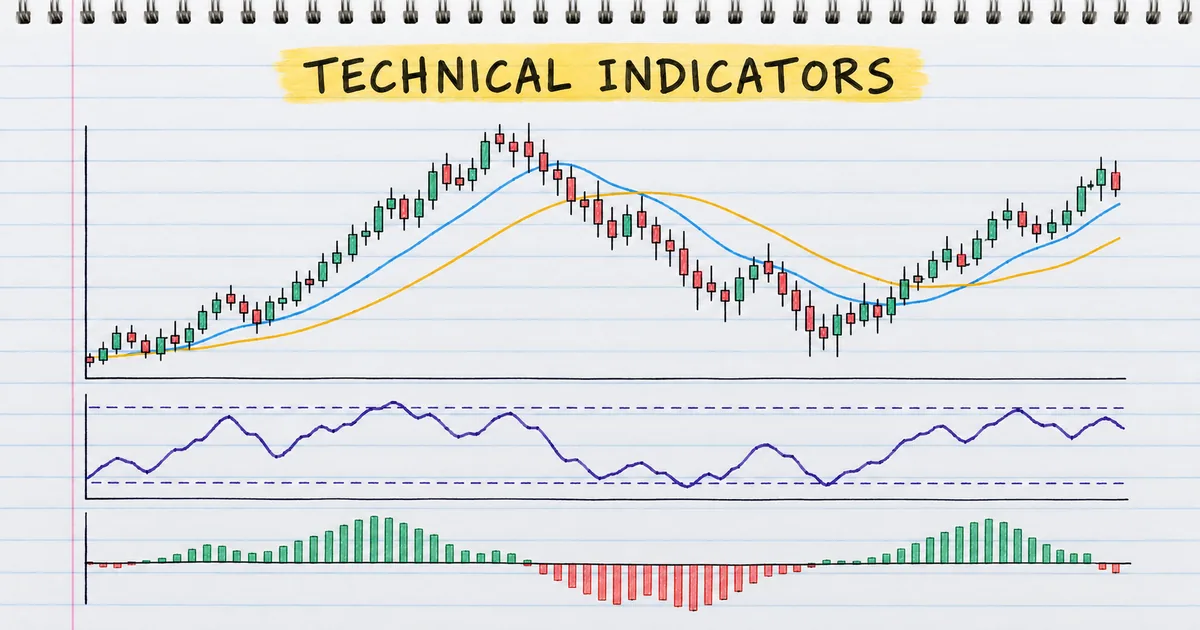
This module explains the most widely used indicators in MetaTrader 5, one lesson each: moving averages, RSI and the stochastic oscillator, MACD, and Bollinger Bands with the Average True Range (ATR). Each lesson shows the formula with a worked example, what the reading describes, and how traders read it in practice. The last lesson shows how to combine indicators so that each one does a different job, instead of stacking several that measure the same thing.
Start with Module 6, Technical Analysis, because indicators make most sense next to price structure. ATR also connects to position sizing from the Beginner level.
What are the main types of forex indicators?
Forex indicators fall into four main types: trend indicators such as moving averages, momentum oscillators such as RSI and stochastic, volatility indicators such as Bollinger Bands and ATR, and volume indicators. MACD sits between trend and momentum. In forex, volume shows tick counts, not traded size, because there is no central exchange.
| Type | Examples | What it describes | Lesson |
|---|---|---|---|
| Trend | Moving averages | Direction, after a move has begun | Moving averages |
| Momentum | RSI, stochastic | How stretched the latest move is | RSI and stochastic |
| Trend and momentum | MACD | The gap between two moving averages | MACD |
| Volatility | Bollinger Bands, ATR | How far price usually travels | Bollinger Bands and ATR |
How do you read a forex indicator?
Read a forex indicator by asking what it measures and how far it lags: a trend indicator shows direction after a move has begun, while an oscillator shows when momentum is stretched within a range. Read either one against price structure, never alone.
Two worked examples. A 20-period simple moving average on the daily chart is the sum of the last 20 closes divided by 20, so closes that add up to 21.8000 give 1.0900. A 14-period RSI above 70 reads as overbought, but in a strong uptrend RSI can stay above 70 for many candles, so traders read it together with the trend from Module 6, Technical Analysis.
Do forex indicators work?
Forex indicators work as summaries of price, not as predictions: they make trend, momentum and volatility easier to read, but every reading comes from candles that have already closed. Their value comes from tested rules that use them, such as an ATR-based stop distance.
For example, an ATR of 60 pips on EURUSD tells you a 15-pip stop sits inside normal daily noise. The ATR indicator entry and the position sizing lesson show how traders turn that reading into a stop distance and a lot size.
What do traders ask about forex indicators?
Traders ask four things first about forex indicators: how leading and lagging indicators differ, how many to use, whether indicators repaint and whether they work on every timeframe. The answers below each stand alone, with links to the lessons that cover them.
What is the difference between leading and lagging indicators?
Lagging indicators, such as moving averages, confirm a move after it has started. Oscillators such as RSI and stochastic are often called leading because they flag stretched momentum before a turn, but they are calculated from past prices too, so they can stay stretched while the trend continues.
How many indicators should you use?
Two or three, each doing a different job: one for trend, one for momentum or timing, and one for volatility. Several indicators of the same type repeat one reading. The using multiple indicators lesson shows how to combine them.
Do forex indicators repaint?
Standard indicators such as moving averages, RSI and MACD do not change once a candle closes, although their value on the open candle moves with each tick. Some, such as ZigZag and many custom indicators, redraw earlier values when new prices arrive, so check before trusting one.
Do indicators work on every timeframe?
Yes. The formula is the same on a 5-minute chart and a daily chart. Lower timeframes give more frequent and noisier signals, so the same settings usually give cleaner readings on the 4-hour and daily charts.
Practise what you learned
Open an account to use MetaTrader 5. Start on a demo account before risking real money.
Open Account