
Revenge Trading: What It Is, Warning Signs and How to Stop
Revenge trading is opening a trade to win back a loss rather than because your plan says so, usually with bigger size, skipped checks and faster entries. Rules written in advance, such as a daily loss limit, stop one bad trade from becoming a bad day.
Module 11 · Lesson 2 of 4
What you'll learn
- Practical rules, called circuit breakers, that keep a losing run small.
- What revenge trading and overtrading are, and how they differ.
- The warning signs to watch for during a trading session.
- How doubling size after losses deepens a drawdown.
What is revenge trading?
Revenge trading is opening a trade to win back money you just lost, rather than because your trading plan says the setup qualifies. It usually shows up as three changes after a loss: a bigger position, skipped checks and faster entries. The reason for the trade has changed from "this setup meets my rules" to "I need that money back".
The next trade has no better chance of winning than the last, but a revenge trade puts more money on it. Skilled traders handle this with circuit breakers: limits decided in advance that end or slow the session after losses. It is covered briefly in the why beginners lose lesson, where it is also called chasing losses. This Trading Psychology module lesson shows how it happens and how to stop it.
What is a drawdown?
A drawdown is the fall in your account from its highest point, usually given as a percentage. An account that falls from $2,000 to $1,840 has an 8% drawdown.
Why do traders revenge trade?
Traders revenge trade because a loss feels like something to fix at once, and a bigger, faster trade looks like the quickest fix. Behavioural economists call the root of this loss aversion: people often strongly prefer avoiding losses to gains of the same size, and when a loss looks likely they tend to take more risk to avoid it.
A Financial Conduct Authority (FCA) paper on behavioural economics, April 2013, describes both effects, and notes that people judge results against a reference point. For a trader, that point is often the day's starting balance, so being below it feels like a problem to fix today.
How does revenge trading make losses bigger?
Revenge trading makes losses bigger because the position grows after each loss, so every new loss is deeper than the one before. The chance of being right has not improved, only the amount at stake, so the drawdown grows much faster than the losing streak.
Worked example, with synthetic numbers. A trader has a $2,000 account and a plan to risk 1% of it, $20, on each trade. The first two trades lose: −$40 in total. Wanting it back, the trader doubles the risk to $40, then doubles again to $80, the same doubling a martingale strategy relies on. Both lose.
| Trade | Risk when size doubles | Total lost | Risk when size stays at $20 | Total lost |
|---|---|---|---|---|
| 1 | $20 | $20 | $20 | $20 |
| 2 | $20 | $40 | $20 | $40 |
| 3 | $40 | $80 | $20 | $60 |
| 4 | $80 | $160 | $20 | $80 |
| Drawdown | $160 (8%) | $80 (4%) |
The same four losing trades cost twice as much. Getting back to $2,000 then needs a gain of $160 on $1,840, which is 8.7%, against $80 on $1,920, which is 4.2%.
To turn a fixed risk into a position size for each trade, use the position size calculator.
What is overtrading?
Overtrading is taking more trades than your plan allows, often out of boredom, frustration or the wish to be busy in the market. It is the slower version of revenge trading: many small trades with weak reasons, spread over days or weeks.
Every trade pays its own spread and any commission, so the more trades you take, the more your winners have to earn just to cover costs. Skilled traders cap their trade count in their written rules and take only setups that qualify.
| Revenge trading | Overtrading | |
|---|---|---|
| Trigger | A loss, often a recent one | Boredom, frustration or habit |
| Speed | Minutes to hours | Days to weeks |
| What changes | Position size grows | Number of trades grows |
| Main damage | A deep drawdown in one session | Costs and small losses piling up |
How do trading costs grow when you trade more often?
Trading costs grow in step with the number of trades, because you pay the spread, and any commission, on every trade, whether it wins or loses. Twice the trades means twice the cost, so overtrading adds cost even when no single trade looks expensive.
For a currency pair quoted in US dollars, such as EURUSD, 0.10 lot is worth about $1 per pip. With a 1.2-pip spread as an example, each trade costs about $1.20 to open and close:
| Trades per week | Spread per trade | Weekly spread cost | Share of a $2,000 account |
|---|---|---|---|
| 5 | $1.20 | $6 | 0.3% |
| 30 | $1.20 | $36 | 1.8% |
Commission and swap, where they apply, add to these figures. The European Securities and Markets Authority (ESMA) lists the costs of a CFD as commissions, bid-offer spreads, daily and overnight financing costs, account fees and taxes. How to work out each cost in money is in the spread, commission and swap lesson.
What are the warning signs of revenge trading?
The main warning signs of revenge trading are changes in why, how big and how fast you trade straight after a loss: a larger size, skipped checks, quicker entries and a moved stop loss. Treat any one of them as a signal to pause.
| Warning sign | What it looks like |
|---|---|
| Size creeps up after a loss | The next trade is larger than your plan allows |
| Checks get skipped | No stop loss set, or the checklist is not read |
| Entries come faster | A new trade opens within minutes of a loss |
| The reason changes | You can say how much you want back, not why the setup qualifies |
| The stop moves | A stop loss is widened so a losing trade stays open |
| Trade count jumps | Far more trades than on a normal day |
How do you stop revenge trading?
To stop revenge trading, write circuit breakers into your trading rules before you trade: limits that end or slow the session after losses, decided while you are calm. It is a decision made in advance about a moment when your judgement is weakest.
Common circuit breakers, using the $2,000 account as an example:
| Circuit breaker | How it works | Example |
|---|---|---|
| Daily loss limit | A set loss, in percent and money, that ends the day | 3%, which is $60 |
| Stop after a set number of losses | A losing run ends the session | Stop after 2 losses in a row |
| Maximum trades per day | A cap that limits overtrading as well as revenge trading | No more than 5 trades a day |
| Time-out | A fixed break after any loss | 30 minutes away from the screen |
| Size never rises after a loss | Risk stays at or below the planned amount | Never above $20 after a loss |
| Close the platform | Log out of MetaTrader 5 once a limit is hit | Close it, do not just minimise it |
In the worked example above, "stop after 2 losses in a row" would have ended the day at −$40, a 2% drawdown, instead of −$160. Skilled traders accept that a limit will sometimes end a session that might have recovered; in exchange, the drawdown stays small.
The same idea on a larger synthetic account, where size doubles from the first loss:
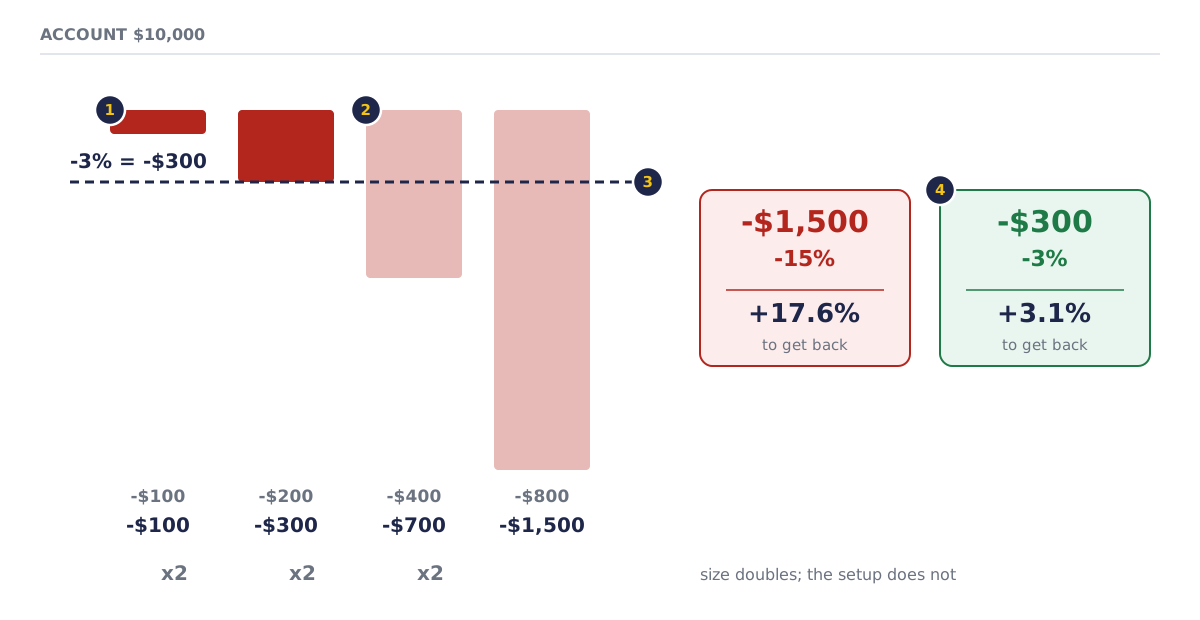
- The first loss of $100 is planned and inside the rules.
- Each trade after it doubles: −$200, −$400, −$800, for a total of −$1,500, or 15%.
- A 3% daily loss limit, written in advance, ends the session at −$300.
- Getting back to $10,000 needs +17.6% without the limit and +3.1% with it.
To set these limits, add them to your written rules, as covered in the writing trading rules lesson, and read them as part of your pre-trade risk checklist.
How do you make circuit breakers stick?
You make circuit breakers stick by keeping them short, visible and decided before the session, because the moment you need a limit is the moment you least want it. A limit you override "just this once" becomes optional, so treat every limit as final and record each break in your journal the same day.
A stop loss fills at the next available price: in a fast or gapping market it can close beyond its level, so a single loss can pass your daily limit. Set the limit with that in mind. Small, capped losses keep both your account and your judgement ready for the next setup that qualifies. Recording rule breaks is covered in this module's trading journal lesson.
Try it on demo
Write a daily loss limit as a percentage and as a money amount, plus a "stop after 2 losses in a row" rule, and keep them next to your screen. Trade a week on a MetaTrader 5 demo account. On any day you reach a limit, close the platform and write one line about the trade you wanted to take next.
Quick check
- Revenge trading is best identified by
- A $2,000 account risks $20, $20, $40 and $80 on four trades and all four lose. The total loss is
- When your written daily loss limit is hit, the rule is to
- At $1.20 in spread per trade, 30 trades a week cost
- Overtrading is
Frequently asked questions
What is a daily loss limit in trading?
A daily loss limit is the most you allow yourself to lose in one day, written in advance as a percentage and a money amount. When it is reached, you stop trading until the next day, rather than trading smaller or switching instruments.
Is revenge trading the same as overtrading?
No. Revenge trading is a reaction to a loss, usually with a bigger position, while overtrading is taking more trades than your plan allows, often out of boredom or habit. They often appear together in the same session.
How many trades a day is overtrading?
Overtrading is any trade past the limit your own plan sets, so the number is the one you write down, such as a cap of 5 trades a day. Trades taken out of boredom or to win back a loss count as overtrading, however few there are.
Sources
- European Securities and Markets Authority (ESMA), Investor warning: Contracts for difference (CFDs), 28 February 2013: CFD costs include commissions, bid-offer spreads, daily and overnight financing costs, account fees and taxes. https://www.esma.europa.eu/sites/default/files/library/2015/11/2013-267.pdf
- Financial Conduct Authority (FCA), Occasional Paper No. 1: Applying behavioural economics at the Financial Conduct Authority, April 2013: loss aversion means people often strongly prefer avoiding losses to acquiring gains; people judge outcomes against a reference point; facing likely losses, people seek risk in the hope of avoiding them. https://www.fca.org.uk/publication/occasional-papers/occasional-paper-1.pdf
Practise what you learned
Open an account to use MetaTrader 5. Start on a demo account before risking real money.
Open Account