
Bollinger Bands and the ATR Indicator: How to Measure Volatility
Bollinger Bands are a 20-period simple moving average with lines two standard deviations above and below it, so they widen when prices swing more and narrow in calm markets. The ATR indicator puts the same volatility into one number, which traders use to set stop distance and position size.
Module 7 · Lesson 4 of 5
What you'll learn
- What Bollinger Bands are and how each line is calculated.
- How traders read a band squeeze and a band touch.
- What the ATR indicator measures and how true range is worked out.
- How traders turn ATR into a stop distance in pips and then a position size.
What are Bollinger Bands?
Bollinger Bands are a volatility indicator made of three lines: a 20-period simple moving average in the middle, and an upper and lower band two standard deviations above and below it. The bands move apart when prices swing more and closer together when prices calm down, so the gap between them shows how volatile the market has recently been.
John Bollinger created the bands in the early 1980s. The MetaTrader 5 help page on Bollinger Bands gives these settings, and Bollinger calls 20 periods a default, not a fixed rule.
Definitions
- Volatility: how far price moves over a period, whatever the direction.
- Simple moving average (SMA): the average closing price of the last N candles. See the moving averages lesson.
- Standard deviation: how spread out the recent closes are around their average. Bunched closes give a small number; spread-out closes give a large one.
- Pip: the standard price step of a currency pair. On EURUSD a pip is 0.0001.
How do you calculate Bollinger Bands?
Middle line = 20-period SMA of the closes; upper band = SMA + (2 × standard deviation); lower band = SMA − (2 × standard deviation). The standard deviation is taken over the same 20 closes. Your platform recalculates all three lines at every new candle, so the bands follow price as it moves.
Synthetic example: the 20-period SMA of EURUSD is 1.0850 and the standard deviation of those closes is 0.0015.
| Line | Calculation | Result |
|---|---|---|
| Middle line | 20-period SMA | 1.0850 |
| Upper band | 1.0850 + (2 × 0.0015) | 1.0880 |
| Lower band | 1.0850 − (2 × 0.0015) | 1.0820 |
| Band width | 1.0880 − 1.0820 | 0.0060, or 60 pips |
What are %b and BandWidth?
%b shows where price sits inside the bands, and BandWidth shows how wide the bands are compared with the middle line. Bollinger added both to put numbers on the picture. A %b of 1 means price is at the upper band, 0 means the lower band, and 0.5 means the middle line.
| Measure | Formula | Example (close 1.0865) |
|---|---|---|
| %b | (price − lower band) ÷ (upper band − lower band) | 0.0045 ÷ 0.0060 = 0.75 |
| BandWidth | (upper band − lower band) ÷ middle line | 0.0060 ÷ 1.0850 = 0.0055 |
Bollinger's rules say BandWidth's most popular use is spotting the squeeze.
What does a Bollinger Band squeeze mean?
A Bollinger Band squeeze is a stretch where the bands sit unusually close together (a low BandWidth), which means recent price moves have been small. Traders watch for it because quiet stretches tend to give way to sharp moves, and the bands then widen fast.
MetaQuotes notes that sharp price changes tend to follow a narrowing of the bands, so traders read a squeeze as a sign a bigger move may come. The bands themselves are direction-neutral, so traders read the direction from price as it breaks out of the quiet range.
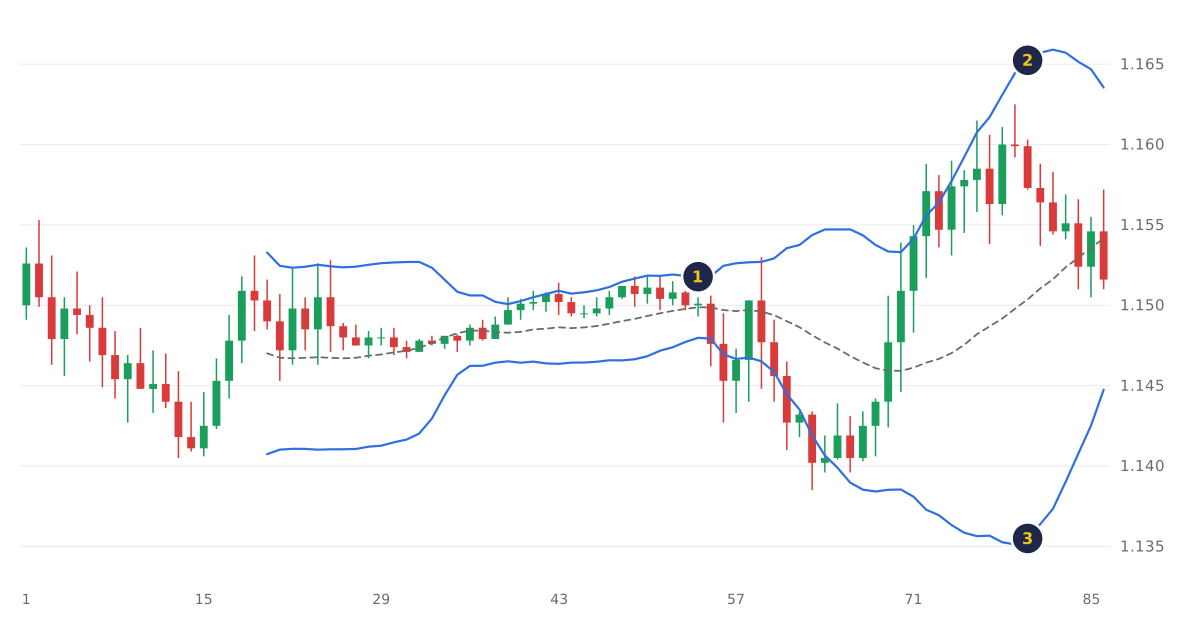
- The squeeze: the bands are about 38 pips apart.
- The upper band after the expansion.
- The lower band: now about 297 pips away. Price fell first, then rose: the direction came from price, not from the bands.
What does it mean when price touches a Bollinger Band?
When price touches the upper band, it is high compared with its own recent average; when it touches the lower band, it is low compared with that average. A touch measures how stretched price is within its recent range of movement, the idea behind a mean reversion strategy.
John Bollinger's own rules say band tags are tags, not signals: an upper-band touch is not by itself a sell signal, and a lower-band touch is not by itself a buy signal. His rules also note that in a strong trend, price can walk along one band for many candles.
What is the average true range (ATR) indicator?
The average true range (ATR) is an indicator that measures volatility as the average size of each candle's true range over a chosen number of candles. It is measured in price units, so on EURUSD a reading of 0.0040 means 40 pips. A higher ATR means bigger candles; it says nothing about direction.
What is true range?
True range is the largest of three distances: the high minus the low, the high minus the previous close, and the low minus the previous close (each taken as a positive number). Including the previous close means a gap between candles is counted. The MetaTrader 5 help page on ATR defines it this way and describes ATR as a moving average of true range values.
Synthetic EURUSD example: previous close 1.0850, then a candle with a high of 1.0880 and a low of 1.0835.
| Distance | Calculation | Result |
|---|---|---|
| High − low | 1.0880 − 1.0835 | 45 pips |
| High − previous close | 1.0880 − 1.0850 | 30 pips |
| Previous close − low | 1.0850 − 1.0835 | 15 pips |
| True range | The largest of the three | 45 pips |
ATR averages these values over a period you choose, for example 14 candles.
How do traders use ATR to set a stop loss and position size?
Traders use ATR to set a stop distance that matches current volatility, for example 1.5 × ATR, and then work out the position size from that stop and the money they accept losing. When ATR rises, the stop widens and the position shrinks, so the money at risk stays the same.
A stop well inside one ATR sits within ordinary candle movement, as the stop loss and take profit lesson explains.
Synthetic example: ATR is 40 pips, you accept losing $50, and EURUSD is $10 per pip per lot in a USD account.
- Stop distance = 1.5 × 40 pips = 60 pips.
- Position size = $50 ÷ (60 × $10) = 0.0833 lot.
- Round down to the 0.01 volume step: 0.08 lot, which loses $48 if the stop is hit.
The same method in calm and busy conditions:
| Calm market | Busy market | |
|---|---|---|
| ATR | 40 pips | 80 pips |
| Stop (1.5 × ATR) | 60 pips | 120 pips |
| Money at risk | $50 | $50 |
| Position size (rounded down) | 0.08 lot | 0.04 lot |
In any account currency the size is again 0.
The formula comes from the position sizing lesson; the position size calculator runs it. See also our guide to forex lot sizes.
What is the difference between Bollinger Bands and ATR?
Bollinger Bands draw volatility on the chart as a channel around price, while ATR turns volatility into a single number in price units. Both describe how much price has moved, whatever the direction. Traders often use the bands to see conditions and ATR to measure them.
| Bollinger Bands | ATR | |
|---|---|---|
| What it shows | A channel around price | One number below the chart |
| Built from | Closing prices: SMA and standard deviation | True range: highs, lows and previous closes |
| Counts gaps | Only through the closes | Yes, through the previous close |
| Common use | Spotting quiet and busy periods | Setting stop distance and position size |
| Shows direction | No | No |
How do you work around Bollinger Band and ATR blind spots?
Traders work around the blind spots of Bollinger Bands and ATR by reading direction from price structure, keeping one setting while they test, and watching the latest candles after news. Both indicators are built from past prices, so they measure volatility that has already happened and react to a sudden jump only after the candles form.
- Lag: a 20-candle average reacts slowly to sudden change, so the size of the latest candles matters after news.
- Direction: neither shows direction, so read it from trend and price structure.
- Settings: a different period or multiple gives a different picture, so keep one setting while comparing readings.
- Gaps: an ATR-based stop sets the planned loss, but in a gap it can fill at a worse price.
How volatility conditions change over time is covered later in the course. All lessons are in the Technical Analysis II: Indicators module.
Try it on demo
On a MetaTrader 5 demo account, open EURUSD and add Bollinger Bands (Insert, Indicators, Trend) and ATR (Insert, Indicators, Oscillators). Note the ATR in a narrow stretch of the bands and in a busier one. Size each with a 1.5 × ATR stop by hand, then check with the position size calculator.
Quick check
- With their standard settings, Bollinger Bands are built from
- A Bollinger Band squeeze tells you that
- The previous close is 1.0850. The next candle has a high of 1.0880 and a low of 1.0835. Its true range is
- ATR is 40 pips, the stop is 1.5 × ATR, the risk is $50 and a pip is worth $10 per lot. The position size is
- Price closes at the upper Bollinger Band. This tells you
Frequently asked questions
What do Bollinger Bands tell you?
Bollinger Bands tell you how volatile price has been recently and where price sits against its 20-period average. A narrowing of the bands, the squeeze, marks a quiet market that sharp moves tend to follow.
What are the best settings for Bollinger Bands?
The standard setting is 20 periods and 2 standard deviations, as MetaTrader 5's help describes, and John Bollinger calls 20 periods a default. His rules suggest about 1.9 standard deviations at 10 periods and 2.1 at 50. Try any change on demo first.
How do you read Bollinger Bands?
Read Bollinger Bands in two steps: the width of the bands shows volatility, and price's position inside them shows how stretched it is against its 20-period average. %b puts that position on a scale from 0 at the lower band to 1 at the upper band. Combining the bands with other indicators is covered in the using multiple indicators lesson.
What is a good ATR value?
A good ATR value is one read against its own history, because ATR depends on the instrument, timeframe and conditions. Compare it with recent readings on the same chart: a rising ATR means bigger candles, and a falling ATR means calmer ones.
Does ATR show trend direction?
No. ATR measures the size of price moves, not their direction; a strong fall and a strong rise can give the same reading.
Sources
- MetaQuotes, MetaTrader 5 Help: Bollinger Bands (accessed 27 October 2026): the 20-period simple moving average middle line, bands two standard deviations away, the middle, top, bottom and standard deviation formulas, and that the bands widen in volatile markets, contract in quieter ones and that abrupt price changes tend to follow a contraction. https://www.metatrader5.com/en/terminal/help/indicators/trend_indicators/bb
- MetaQuotes, MetaTrader 5 Help: Average True Range (accessed 27 October 2026): true range as the greatest of high − low, previous close − high and previous close − low; ATR as a moving average of true range values that shows market volatility. https://www.metatrader5.com/en/terminal/help/indicators/oscillators/atr
- John Bollinger, Bollinger Band Rules, bollingerbands.com (accessed 27 October 2026): band tags are not signals by themselves; price can walk up or down a band in a trend; 20 periods is a default, with about 1.9 standard deviations at 10 periods and 2.1 at 50; %b shows where price is in relation to the bands (an adaptation of the Stochastics formula); BandWidth is the band width normalised by the middle band and is most often used to spot the squeeze. https://www.bollingerbands.com/bollinger-band-rules
- John Bollinger, Official Bollinger Band website, bollingerbands.com (accessed 27 October 2026): Bollinger Bands were created by John Bollinger in the early 1980s. https://www.bollingerbands.com/
Practise what you learned
Open an account to use MetaTrader 5. Start on a demo account before risking real money.
Open Account