
MACD Indicator: How the MACD Line, Signal Line and Histogram Work
MACD (Moving Average Convergence/Divergence) is an indicator that measures the gap between a 12-period and a 26-period exponential moving average of price. Traders read it through crossovers, the zero line and divergence to judge the direction and strength of momentum.
Module 7 · Lesson 3 of 5
What you'll learn
- What the MACD indicator measures and how it is built from two moving averages.
- How to calculate the MACD line, signal line and histogram, with a worked example.
- How the MACD built into MetaTrader 5 differs from the usual two-line picture.
- How traders read crossovers and divergence, and how MACD's lag shapes that reading.
What is the MACD indicator?
MACD (Moving Average Convergence/Divergence) is an indicator that shows the gap between a 12-period and a 26-period exponential moving average of the closing price. When the gap widens, the faster average is pulling away from the slower one. When it narrows, the two averages are coming together. That is where the name comes from.
MetaTrader 5's help describes MACD as a trend-following indicator. MACD is not new information: it is two of the averages from the moving averages lesson, subtracted from each other.
What is an exponential moving average?
An exponential moving average (EMA) is an average of recent closing prices that gives more weight to the newest candles. A 12-period EMA reacts faster than a 26-period EMA. A period is one candle on your chosen timeframe.
What are the three parts of MACD?
MACD has three parts: the MACD line (the 12-period EMA minus the 26-period EMA), the signal line (a 9-period average of the MACD line) and the histogram (the MACD line minus the signal line). All three come from the same two averages, so they describe one thing, the changing gap between them, in three ways.
| Part | How it is built | What it describes |
|---|---|---|
| MACD line | 12-period EMA − 26-period EMA | How far apart the fast and slow averages are |
| Signal line | 9-period average of the MACD line | A smoothed, slower version of the MACD line |
| Histogram | MACD line − signal line | Whether the gap is currently growing faster or slower than its own average |
What does the MACD histogram show?
The MACD histogram shows the distance between the MACD line and its signal line, drawn as bars around zero. Bars above zero mean MACD is above its signal. Growing bars mean that distance is widening; shrinking bars mean it is narrowing. The bars cross zero on the candle where the two lines cross. In MetaTrader 5 the bars mean something else, as shown below.
What is the zero line?
The zero line is the level where the MACD line equals zero, which happens when the 12-period EMA and the 26-period EMA are exactly equal. Above zero, the fast average is above the slow one. Crossing zero is the same event as the 12-period EMA crossing the 26-period EMA, the same kind of moving-average crossover as a golden cross, on faster averages.
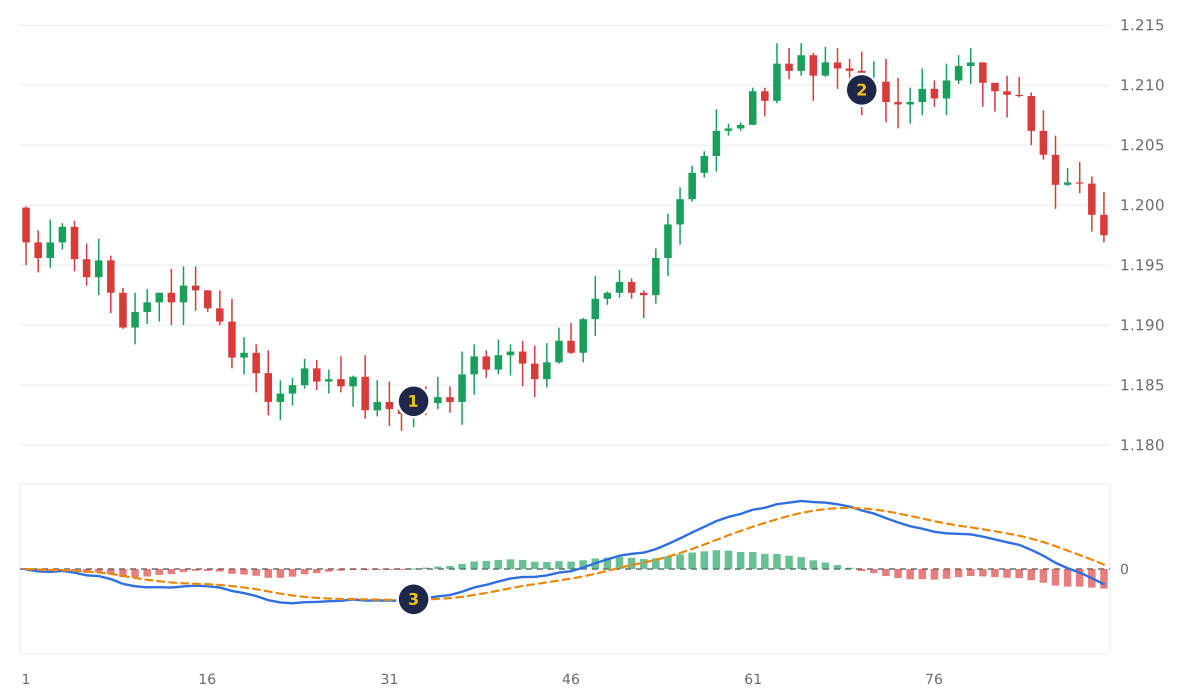
- The MACD line crosses above the signal line one candle after the lowest point of the fall.
- It crosses back below 37 candles later, seven candles after the highest point of the rise.
- The first crossing seen in the indicator panel, where the histogram turns from below zero to above it.
This is the common two-line layout; MetaTrader 5's version looks different.
How do you calculate MACD?
To calculate MACD, subtract the 26-period EMA from the 12-period EMA. Then take a 9-period average of that result to get the signal line, and subtract the signal line from the MACD line to get the histogram. Your platform repeats this on every new candle.
Worked example, synthetic EURUSD figures:
| Step | Calculation | Result |
|---|---|---|
| 1. MACD line | 12-period EMA 1.08520 − 26-period EMA 1.08470 | +0.00050 (5 pips) |
| 2. Signal line | 9-period average of recent MACD values (given) | +0.00035 (3.5 pips) |
| 3. Histogram | 0.00050 − 0.00035 | +0.00015 (1.5 pips) |
Check it backwards: 0.00035 + 0.00015 = 0.00050, and 1.08470 + 0.00050 = 1.08520.
What this reading describes: the faster average sits 5 pips above the slower one, and that gap is wider than its own 9-period average. Recent closes have been higher than older ones.
The MACD value is a distance between two averages, measured in price units, so it reads as momentum rather than as a price target.
To get a feel for size, 5 pips is the same distance as a 5-pip price move. On 0.10 lot of EURUSD, a pip is worth about $1, so a 5-pip move is about $5. Pip values are explained in the lots, pips and pip value lesson, and the pip value calculator works them out for other pairs.
How is MACD in MetaTrader 5 different?
MetaTrader 5's built-in MACD draws the MACD line as histogram bars and the signal line as a dotted line, and it calculates the signal line as a simple moving average (SMA). Other charts often show two lines plus a histogram. The MACD formula itself is the same.
MetaQuotes' MQL5 reference confirms that MT5 draws MACD as a histogram, while other systems show two lines. MT5 offers MACD − signal as a separate indicator, Moving Average of Oscillator (OsMA).
| Common two-line layout | MetaTrader 5 built-in MACD | |
|---|---|---|
| MACD line | 12-EMA − 26-EMA, drawn as a line | 12-EMA − 26-EMA, drawn as bars |
| Signal line | 9-period average of MACD; the type of average varies by platform | 9-period SMA of MACD, drawn as a dotted line |
| Bars show | MACD − signal | The MACD value itself |
| MACD − signal | The histogram | A separate indicator, OsMA |
So in MT5, bars above zero mean the MACD is positive, not that MACD is above its signal. In the worked example, MT5 would show a bar at +0.00050 with the dotted line at +0.00035.
How do traders read MACD crossovers and divergence?
Traders read a MACD crossover as confirmation that momentum has shifted, and a divergence as a sign that a trend is losing force. Both are built from moving averages of past prices, so they appear after the price change has started. Traders read them alongside trend and price structure.
What is a MACD crossover?
A MACD crossover is the moment the MACD line crosses its signal line, or the moment MACD crosses the zero line. Traders read a cross upward as momentum turning up. It confirms a change already under way, which is why traders check that price is trending first: in a sideways market the lines cross back and forth.
What is MACD divergence?
MACD divergence is when price and MACD move in different directions: for example, price makes a higher high while MACD makes a lower high. Traders read it as momentum fading, and wait for price to confirm, such as a break of the last swing low, because divergence can build over several swings before the trend turns.
What are the best MACD settings?
The standard MACD settings are 12, 26 and 9, applied to the closing price, and they are the defaults most charts start with. Shorter periods make MACD react sooner and produce more crossings. Longer periods make it smoother and slower, with fewer crossings. Pick the speed that matches your timeframe.
| Change | Effect |
|---|---|
| Shorter fast and slow periods | Reacts sooner, more crossings, more noise |
| Longer fast and slow periods | Smoother, fewer crossings, more lag |
| Shorter signal period | Signal line hugs the MACD line more closely |
How do you add MACD in MetaTrader 5?
To add MACD in MetaTrader 5, drag it from the Navigator onto a chart, or use Insert, then Indicators, then Oscillators. The MT5 help notes that MACD opens in a separate window below price, with its own vertical scale. You set its periods when you add it.
- Open a chart and choose a timeframe.
- In the Navigator, open Indicators, then Oscillators, and drag MACD onto the chart.
- In the parameters window, keep 12, 26 and 9 and apply it to Close to start.
- Click OK. To change settings later, right-click the MACD window and choose Properties.
How do skilled traders handle MACD's lag?
Skilled traders handle MACD's lag by reading crossovers as confirmation of a turn already under way, checking that price is trending first, and taking stop levels from price structure. Every part of MACD is built from moving averages, so a crossover arrives after the turn in price, and in a sideways market the lines cross often.
- Lag. Expect crossings after the turn: in the diagram above, the second crossing came seven candles after the high.
- Ranges. Check the trend first. In a sideways market each crossing looks like a change, and each trade pays the spread. The trends and ranges lesson shows how to tell the two apart.
- Stops from price. MACD has no fixed top or bottom, so traders place a stop-loss at price structure.
- Like with like. MACD is measured in the instrument's own price units, so 0.0005 on EURUSD and 5.0 on gold are not comparable. Compare a reading with the same instrument's history.
Try it on demo
On a demo account in MetaTrader 5, add MACD with default settings to a D1 EURUSD chart. Mark every point where the bars change from below zero to above zero, or back, over the last six months. Beside each, note whether price was trending or ranging, and how many candles after the price turn the change came.
This lesson is part of the Technical Analysis II: Indicators module.
Quick check
- The MACD line is
- MACD is 0.00050 and the signal line is 0.00035. The histogram is
- MACD above the zero line means
- In the MACD built into MetaTrader 5, the bars show
- Why does MACD react after price has already turned?
Frequently asked questions
What does MACD stand for?
MACD stands for Moving Average Convergence/Divergence. Convergence means the two moving averages are coming together, and divergence means they are moving apart.
Is MACD a leading or lagging indicator?
MACD is a lagging indicator. It is built from moving averages of past closing prices, and the signal line is an average of those, so it reacts after price has already started to change.
What is the difference between MACD and RSI?
MACD measures the gap between two moving averages in price terms, so it has no fixed top or bottom. RSI compares the size of recent gains with recent losses on a fixed 0 to 100 scale; it is covered in the RSI and stochastic lesson of this module.
Sources
- MetaQuotes, MetaTrader 5 Help: MACD, accessed 19 October 2026: MACD is a trend-following indicator; MACD = EMA(CLOSE, 12) − EMA(CLOSE, 26); the signal line is a 9-period dotted simple moving average of MACD (SIGNAL = SMA(MACD, 9)); the page's chart shows MACD as bars with the signal as a line. https://www.metatrader5.com/en/terminal/help/indicators/oscillators/macd
- MetaQuotes, MQL5 Reference: iMACD, accessed 19 October 2026: in the client terminal MACD looks like a histogram; in systems where OsMA is called the MACD histogram, MACD is shown as two lines. https://www.mql5.com/en/docs/indicators/imacd
- MetaQuotes, MetaTrader 5 Help: Moving Average of Oscillator, accessed 19 October 2026: OsMA = MACD − SIGNAL. https://www.metatrader5.com/en/terminal/help/indicators/oscillators/mao
- MetaQuotes, MetaTrader 5 Help: Technical Indicators, accessed 19 October 2026: indicators are applied by dragging from the Navigator or with Insert, Indicators; MACD is drawn in a separate indicator window. https://www.metatrader5.com/en/terminal/help/charts_analysis/indicators
Practise what you learned
Open an account to use MetaTrader 5. Start on a demo account before risking real money.
Open Account