
Moving Average: What It Is, SMA vs EMA and How to Read It
A moving average is the average closing price of the last N candles, recalculated as each new candle closes and drawn as one smooth line on your chart. It smooths out noise so the direction of recent price is easy to see, at the cost of some lag behind the latest close.
Module 7 · Lesson 1 of 5
What you'll learn
- What a moving average is and how to calculate one.
- How a simple (SMA) and an exponential (EMA) moving average differ.
- Why every moving average lags, and how the period changes that.
- How traders read price position and crossovers around an average.
This is the first lesson of the Technical Indicators module.
What is a moving average?
A moving average is the average closing price of the last N candles, recalculated each time a new candle closes and drawn as a line on the chart. N is the period you choose. Each new close replaces the oldest, so the line moves with price and smooths out small swings.
MetaTrader 5's help lists four types. They differ only in how they weight the closes in the window:
| Type | How it weights the closes |
|---|---|
| Simple (SMA) | Every close counts equally |
| Exponential (EMA) | The newest close counts most; older closes fade |
| Smoothed (SMMA) | Keeps (N − 1) ÷ N of the previous value and adds 1 ÷ N of the new close |
| Linear weighted (LWMA) | Weights rise in steps: the newest close × N, the oldest × 1 |
This lesson works through the SMA and EMA, the two most common.
Key terms
- Period (N): the number of candles in the average. A 20-period average on a daily chart uses the last 20 daily closes.
- Lag: the delay between price turning and the average turning.
How do you calculate a simple moving average (SMA)?
A simple moving average (SMA) adds up the last N closing prices and divides the total by N, so every candle in the window counts equally. MetaTrader 5's help writes it as SMA = SUM(CLOSE(i), N) ÷ N. On each new candle, the oldest close drops out and the newest comes in.
Worked example with five synthetic EURUSD daily closes:
| Candle | Close |
|---|---|
| 1 | 1.0810 |
| 2 | 1.0825 |
| 3 | 1.0830 |
| 4 | 1.0815 |
| 5 | 1.0840 |
| Sum | 5.4120 |
5-period SMA = 5.4120 ÷ 5 = 1.0824.
What is an exponential moving average (EMA)?
An exponential moving average (EMA) is a moving average that gives the newest close more weight than older closes, so it turns sooner when price changes direction. Each new EMA value blends the latest close with the previous EMA, so older closes fade rather than drop out.
MetaTrader 5's help gives EMA = (CLOSE(i) × P) + (EMA(i − 1) × (1 − P)), where the smoothing constant P is 2 ÷ (N + 1) for an N-period EMA. For N = 5, P = 2 ÷ 6 = 0.3333: the newest close carries a third of the weight.
One EMA step, continuing the example from a previous value of 1.0824 (the SMA, a common starting point; platforms can start differently). The next candle closes at 1.0870:
- EMA = (1.0870 × 0.3333) + (1.0824 × 0.6667) = 1.0839
- The new 5-period SMA drops 1.0810 and adds 1.0870: 5.4180 ÷ 5 = 1.0836
The EMA moved about 15 pips towards the new close, the SMA 12.
EMA vs SMA: what is the difference?
The difference between an EMA and an SMA is how they weight closes: the SMA weights every close in the window equally, while the EMA weights the newest close most. That makes the EMA turn sooner after price changes direction, and also makes it react more often to short swings that come to nothing.
| Simple moving average (SMA) | Exponential moving average (EMA) | |
|---|---|---|
| Formula | SUM(CLOSE, N) ÷ N | (CLOSE × P) + (previous EMA × (1 − P)), with P = 2 ÷ (N + 1) |
| Weight of the newest close (N = 5) | 20% | 33.3% |
| Older closes | Count equally, then drop out after N candles | Fade gradually, never fully removed |
| Reaction to a turn | Later | Sooner |
| Reaction to short noise | Less | More |
Why does a moving average lag behind price?
A moving average lags because it is built only from closes that have already happened, so it can only turn after price has turned. Averaging older prices with newer ones is what makes the line smooth, and that same averaging is what makes it late. Lag is the cost of smoothing, not a setting you can remove.
In the SMA example, the latest close was 1.0840 and the average 1.0824:
- Lag = 1.0840 − 1.0824 = 0.0016 = 16 pips
- On 0.10 lot of EURUSD, at about $1 per pip, that distance is worth about $16.
Pip values are explained in the lots, pips and pip value lesson; the pip value calculator works them out for other pairs.
How does the moving average period change what you see?
A shorter period follows price closely and turns quickly but reacts to more noise, while a longer period is smoother but lags further behind. The period is the main setting of a moving average. It sets how much past price the line summarises, so traders choose it to match the swings they care about.
| Period | Smoothness | Lag | On a daily chart, it summarises |
|---|---|---|---|
| Short (10 to 20) | Choppy | Small | The last two to four weeks |
| Medium (50) | Moderate | Moderate | About ten weeks |
| Long (200) | Very smooth | Large | About 200 trading days |
The same period covers different spans on different chart timeframes: 50 one-hour candles are about two days of trading.
How do traders read price above or below a moving average?
Traders often describe price holding above a rising moving average as an uptrend, and price below a falling one as a downtrend. It describes past price, like marking swing highs and lows in the trends and ranges lesson. In a sideways market, a flat average with price crossing it back and forth marks a range.
Some traders also watch price near an average, as they watch support and resistance levels. An average works as a reference zone rather than a fixed barrier, so traders watch how price behaves around it.
What is a moving average crossover?
A moving average crossover is the point where a faster, shorter-period average crosses a slower, longer-period one. When the 50-period crosses above the 200-period, it is often called a golden cross; when it crosses below, a death cross. Traders read these as confirming a change of direction; because both lines lag, the turn has already started.
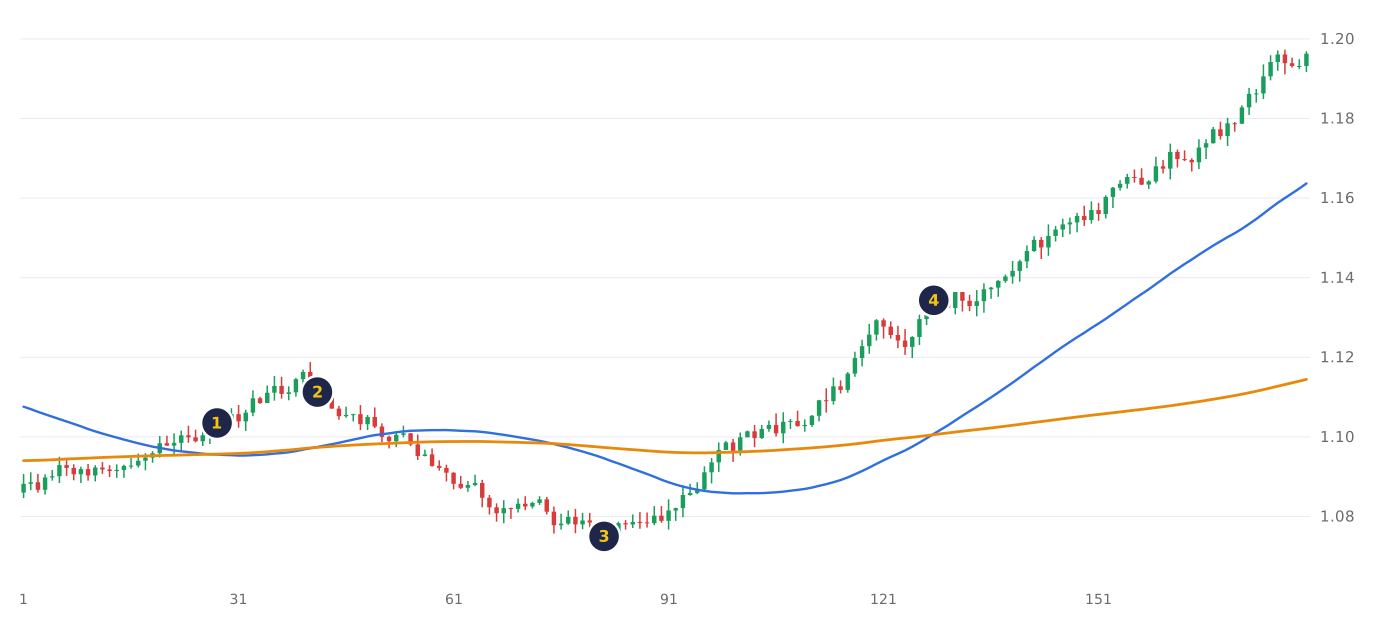
- Candle 28: the 50 crosses below the 200, then back above 14 candles later.
- Candle 42: that crossing above, a golden cross. The 50 falls back below the 200 33 candles later.
- Candle 82: the lowest close of the move, 1.0750.
- Candle 128: the crossover that held to the chart's end, with price at 1.1343, 593 pips above the lowest close.
From the lowest close (1.0750) to the last close (1.1963), price moved 1,213 pips. By crossover 4, 593 of those pips, about 49%, had already happened, and three of the four crossings reversed. That is the trade-off of confirmation: it arrives later, with part of the move already made.
How do traders handle moving average lag and whipsaws?
Skilled traders handle lag by choosing the period and type for the job, and handle whipsaws by checking the slope of the average before reading a crossing. A flat average marks a range, where crossings come often and each trade pays the spread. A sloping average marks a trend, where crossings carry more meaning.
- Lag: use an EMA or a shorter period for earlier turns; use a longer period for a cleaner, later line.
- Whipsaws: read the slope first. A flat average means price is ranging.
- Period choice: test one period across several charts and timeframes on demo, not just the chart it was picked on.
- Gaps: after news or a weekend, price can jump past an average, so the exit plan rests on a stop-loss, not the line.
- Risk control: the average reads the trend; position size and a stop-loss set the amount at risk.
How do you add a moving average in MetaTrader 5?
To add a moving average in MetaTrader 5, open the Navigator, expand Indicators, then Trend, and drag Moving Average onto the chart. You can also use the Indicators command in the Insert menu. A settings window then asks for the period and the method, such as Simple or Exponential.
- Open a chart, for example EURUSD D1.
- Drag Moving Average from Navigator, Indicators, Trend onto the chart.
- Set the period and method. Leave Apply to on Close to match this lesson's formulas.
- Confirm, then hover over the line to see its value at any candle.
Try it on demo
On a demo account in MetaTrader 5, add 50- and 200-period Simple moving averages to a EURUSD D1 chart, and the same periods as Exponential on a second chart. Scroll back one year and count each pair's crossings. For each, note how far price had already moved from its last swing low or high.
Quick check
- A 5-period simple moving average is calculated by
- Compared with an SMA of the same period, an EMA
- For a 9-period EMA, the smoothing constant P = 2 ÷ (N + 1) is
- The latest close is 1.0840 and the 5-period SMA is 1.0824. On 0.10 lot of EURUSD at about $1 per pip, that gap is worth about
- A golden cross appears on a daily chart. This tells you that
Frequently asked questions
Is EMA or SMA better?
The EMA is better for reacting quickly and the SMA for a steadier line. The EMA turns sooner after price changes direction but reacts to more noise; the SMA is smoother but turns later. Many traders use one of each for different jobs.
What is a golden cross?
A golden cross is the moment the 50-period moving average crosses above the 200-period. Its opposite is a death cross. Both confirm a change that has already started in price.
Do moving averages work?
Yes, as a trend tool: a moving average smooths out noise so the direction of recent closes is easy to see, and traders read its slope, price position and crossovers to judge trend. It is clearest in trending markets; in a sideways market the line flattens and its crossings flip back and forth.
What do the 50 and 200 moving averages mean?
They are simply common periods: the average of the last 50 or 200 closes on the chart you are viewing. On a daily chart, that is about ten weeks and about 200 trading days. They are the most widely quoted periods, which is why so many traders watch the same two lines.
Sources
- MetaQuotes, MetaTrader 5 Help: Moving Average, accessed 19 October 2026: the moving average shows the mean price over a period; four types (simple, exponential, smoothed, linear weighted); SMA = SUM(CLOSE(i), N) / N, with all prices equal in value; EMA = (CLOSE(i) × P) + (EMA(i − 1) × (1 − P)); the EMA attaches more value to the latest prices; SMMA(i) = (SMMA(i − 1) × (N − 1) + CLOSE(i)) / N; LWMA = SUM(CLOSE(i) × i, N) / SUM(i, N), giving the latest data more value; it can be calculated on closes or other price data. https://www.metatrader5.com/en/terminal/help/indicators/trend_indicators/ma
- MetaQuotes, MetaTrader 5 Help: Adaptive Moving Average, accessed 19 October 2026: SC = 2/(n+1) is the EMA smoothing constant, where n is the period of the exponential moving average. https://www.metatrader5.com/en/terminal/help/indicators/trend_indicators/ama
- MetaQuotes, MetaTrader 5 Help: Trend Indicators, accessed 19 October 2026: Moving Average is listed in the Trend Indicators group. https://www.metatrader5.com/en/terminal/help/indicators/trend_indicators
- MetaQuotes, MetaTrader 5 Help: Indicators, accessed 19 October 2026: indicators are applied by dragging them from the Navigator window or with the Indicators command in the Insert menu; the Apply to field sets the price used; hovering over an indicator line shows its value. https://www.metatrader5.com/en/terminal/help/charts_analysis/indicators
Practise what you learned
Open an account to use MetaTrader 5. Start on a demo account before risking real money.
Open Account