
What Is NFP? Non-Farm Payrolls, CPI, GDP and Rate Decisions
NFP, or non-farm payrolls, is the monthly US employment report from the Bureau of Labor Statistics, showing how many jobs employers outside farming added or cut. With CPI inflation, GDP and central bank rate decisions, it is one of the scheduled releases markets watch most, because prices react to the gap between forecast and result.
Module 8 · Lesson 2 of 5
What you'll learn
- What NFP measures and what else is in the US jobs report.
- When NFP lands in your own time zone.
- What CPI, GDP and rate decisions measure, compared in one table.
- How to work out the surprise in a release.
What is NFP?
NFP, or non-farm payrolls, is the monthly change in the number of jobs on US payrolls outside farming, published by the US Bureau of Labor Statistics (BLS). It is the headline of the Employment Situation report, the US jobs report. A positive number means employers added jobs that month; a negative one means jobs were lost.
It comes from a monthly survey of about 119,000 businesses and government agencies. Government jobs count, but the survey excludes farm workers, the unincorporated self-employed, unpaid family workers and private household workers. In the September 2026 report, released by the BLS on 2 October 2026, nonfarm payrolls rose by 29,000.
What else is in the jobs report?
The report combines a survey of employers (the establishment survey) and a survey of about 60,000 households. Its three most-watched figures, from the BLS report released 2 October 2026:
| Figure | Survey | What it measures | September 2026 |
|---|---|---|---|
| Nonfarm payrolls | Establishment | Change in jobs outside farming | +29,000 |
| Unemployment rate | Household | Unemployed people (no job, available, actively looking) as a share of the labour force | 4.2% |
| Average hourly earnings | Establishment | Pay per hour for private nonfarm employees | $37.81, up 0.1% |
What are NFP revisions?
A revision is a change to a figure already published, made when more data arrive. The BLS routinely revises the previous two months of payroll data, so each report also changes the last two. In the September 2026 report (BLS, 2 October 2026), July was revised from +21,000 to −10,000 and August from +162,000 to +133,000.
When is NFP released?
NFP is usually released on the first Friday of the month at 8:30 a.m. Eastern Time (ET), New York time. In October 2026, the BLS release schedule listed the next two dates as Friday 6 November and Friday 4 December 2026, both at 8:30 a.m. Confirm the date there, as schedules can change.
Much of Africa and Asia does not use daylight saving time, but US clocks do, from the second Sunday of March to the first Sunday of November, so the local time moves by an hour twice a year:
| US clocks | 8:30 a.m. ET is | UTC+1 (West and Central Africa) | UTC+2 (Southern Africa) | UTC+7 (mainland Southeast Asia) | UTC+8 (maritime Southeast Asia and East Asia) |
|---|---|---|---|---|---|
| Daylight time (March to early November) | 12:30 UTC | 13:30 | 14:30 | 19:30 | 20:30 |
| Standard time (early November to March) | 13:30 UTC | 14:30 | 15:30 | 20:30 | 21:30 |
The 6 November 2026 release falls after US clocks change on 1 November, so it lands at 14:30 at UTC+1 and 21:30 at UTC+8.
How does NFP affect forex?
NFP affects forex mainly through interest rate expectations, because the Federal Reserve is tasked with maximum employment and stable prices. Jobs and wage growth above forecast can make markets expect US rates to stay higher; weaker figures, the reverse. Traders often read a strong report as supportive for the US dollar.
It shows in USD currency pairs such as EURUSD and USDJPY, and often in gold and US stock indices. The full reaction depends on the forecast, unemployment, wages and revisions together, so experienced traders read all four before acting on the first move.
What is CPI?
CPI, the consumer price index, measures the change in prices paid by consumers for goods and services. The BLS publishes it monthly at 8:30 a.m. ET, and its rate of change is a key measure of US inflation, meaning how fast prices are rising.
Headline vs core CPI
- Headline CPI covers all items.
- Core CPI is all items less food and energy, whose prices often swing sharply.
Month-on-month vs year-on-year
- Month-on-month (m/m): the change from last month, seasonally adjusted.
- Year-on-year (y/y): the change over the past 12 months.
In the September 2026 CPI report, released by the BLS on 14 October 2026, headline CPI rose 0.6% m/m and 3.7% y/y, while core rose 0.3% m/m and 2.6% y/y.
How does CPI affect forex?
CPI affects forex mainly through interest rate expectations: inflation above forecast can make markets expect a central bank to keep rates higher, and inflation below forecast the reverse. Traders often read a higher-than-expected CPI as supportive for that currency. The size of the move depends on how far the actual lands from what was already expected.
How rates feed into currencies is covered in central banks and currencies, and a worked CPI surprise on EURUSD is in what is CPI.
What is GDP?
GDP, gross domestic product, measures the value of the final goods and services produced in a country. The US Bureau of Economic Analysis (BEA) publishes it quarterly as an annualized rate, meaning the quarter's growth scaled to a full year. Each quarter gets three estimates:
- Advance: near the end of the first month after the quarter ends, on incomplete data.
- Second: near the end of the second month, with more complete data.
- Third: near the end of the third month.
Other economies publish GDP on their own schedules, and the GDP glossary entry explains how to read it.
What is PMI?
PMI, the Purchasing Managers' Index, is a monthly survey of company purchasing managers that reads above 50 when business conditions are improving and below 50 when they are worsening. Because it arrives weeks before GDP, traders treat it as an early read on growth. The Institute for Supply Management (ISM) publishes the US manufacturing PMI on the first business day of each month.
PMI is a diffusion index: the share of firms reporting improvement plus half the share reporting no change. If 30% of managers report higher orders, 50% no change and 20% lower, the reading is 30 + 50 ÷ 2 = 55, a clear expansion. A move from 49 to 51 matters more to traders than its size suggests, because it crosses 50. S&P Global compiles PMIs for many other economies, read the same way.
What is a rate decision?
A rate decision is a central bank's announcement of its policy interest rate, the rate that steers borrowing costs across an economy. A statement explains it. In the US, the Federal Open Market Committee (FOMC) decides it. The FOMC holds eight regularly scheduled meetings a year; the remaining 2026 meetings are 27-28 October and 8-9 December.
How do the major releases compare?
NFP and CPI are monthly US releases from the BLS, GDP is a quarterly release from the BEA, and rate decisions come from the Federal Reserve at eight scheduled meetings a year. Each measures a different part of the economy; all feed into expectations for growth and interest rates.
| Release | Who publishes | How often | What it measures | Why markets watch it |
|---|---|---|---|---|
| NFP (jobs report) | US Bureau of Labor Statistics | Monthly, usually first Friday | Change in jobs outside farming, plus unemployment and wages | A read on the job market and wage pressure |
| CPI | US Bureau of Labor Statistics | Monthly | Change in consumer prices | Inflation shapes interest rate expectations |
| GDP | US Bureau of Economic Analysis | Quarterly, three estimates | Value of final goods and services produced | A comprehensive measure of economic activity |
| Rate decision | Federal Reserve (FOMC) | Eight scheduled meetings a year | The policy interest rate | Rates feed directly into currency demand |
Other releases, such as purchasing managers' index (PMI) surveys and retail sales, also appear on the calendar. How to read it is covered in the economic calendar lesson.
How do you work out the surprise in a release?
The surprise is the actual figure minus the forecast, the consensus estimate shown on an economic calendar. Prices already reflect the forecast, so the gap is the new information, as explained in what moves market prices. A result exactly in line with the forecast often moves prices little.
Worked example: a synthetic NFP release
These figures are invented for teaching:
| Forecast | Actual | |
|---|---|---|
| This month's NFP | +180k | +250k |
| Last month's NFP | +200k (first published) | +170k (revised) |
- Headline surprise: 250k − 180k = +70k above forecast.
- Revision: last month fell from 200k to 170k, so −30k.
- Two-month picture: 170k + 250k = 420k, against the 380k the market had (200k + 180k), so +40k net.
The beat is smaller than the headline suggests. Unemployment and wages can point another way too, which is one reason a first reaction can reverse.
Now say EURUSD covers a synthetic 50-pip range in the first minute. At 0.10 lot, where one pip is worth $1 (see lots, pips and pip value), that is 50 × $1 = $50, gained or lost depending on direction. Check other sizes with the pip value calculator.
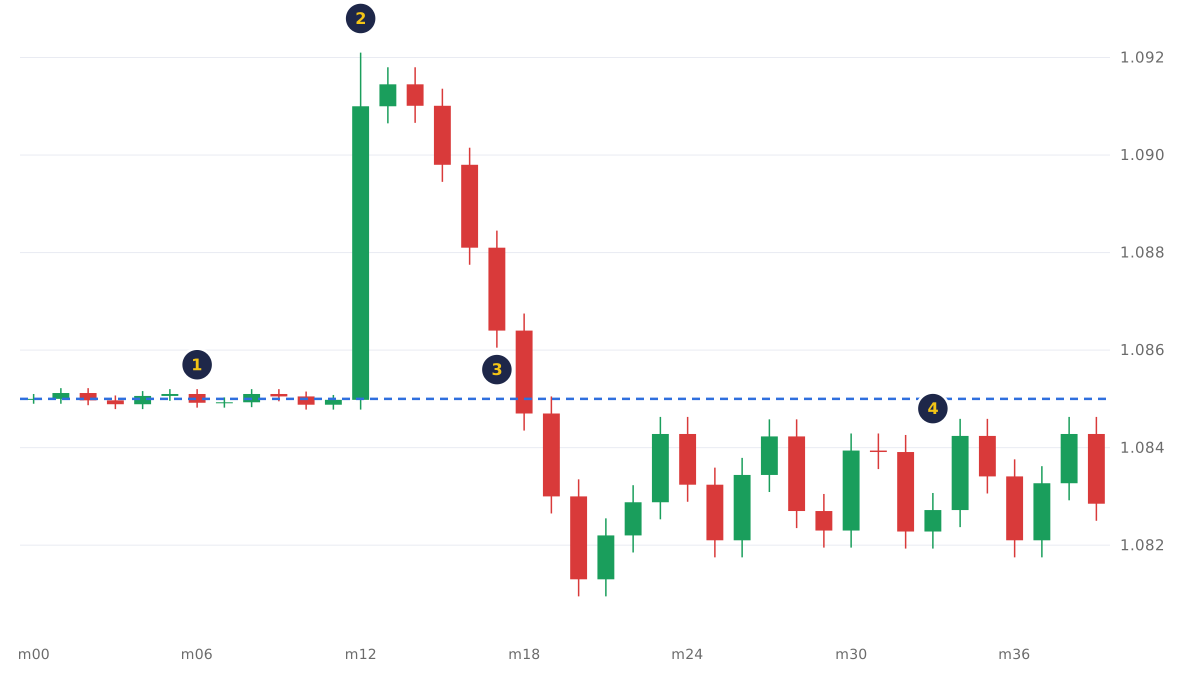
A separate synthetic chart around a release:
- Before: small candles near the dashed pre-release price, about 1.0850.
- Release minute: one candle jumps to about 1.0920, roughly 70 pips.
- Reversal: price falls back through 1.0850 to about 1.0810.
- Settling: a narrower range, roughly 1.082 to 1.085.
How do prices behave around major releases?
Around major releases, prices can move further and faster than usual, and the first move can reverse. Spreads often widen around the number, and an order or stop-loss can fill at a worse price than its level in a fast market.
Revisions also change the picture a month later, so check them in each new report. Gaps and slippage around news are covered in Module 10, Trade Management.
Try it on demo
Find the next NFP date on the BLS schedule and convert it to your local time. On a MetaTrader 5 demo account, open a one-minute EURUSD chart and switch on the Spread column in Market Watch. Watch the ten minutes around the release without a position, and note the spread before, during and after.
This lesson is part of the Fundamental Analysis module.
Quick check
- NFP measures
- NFP is forecast at +180k and comes in at +250k. The surprise is
- Core CPI leaves out
- How many regularly scheduled meetings does the US Federal Reserve's FOMC hold each year?
- A 50-pip range on 0.10 lot of EURUSD, at $1 per pip, is worth
Frequently asked questions
What time is NFP released in my time zone?
NFP is released at 8:30 a.m. New York time: 12:30 UTC from March to early November and 13:30 UTC from early November to March. Add your offset: at UTC+1 that is 13:30 or 14:30, and at UTC+8 it is 20:30 or 21:30.
What is a good NFP number?
A good NFP number for the dollar is one that beats the forecast, because markets compare the result with expectations. A gain of 150,000 jobs can disappoint if 250,000 was expected, and revisions to earlier months change the picture too.
Why do prices move so much during NFP?
Because a surprise changes what traders expect about the economy and interest rates, and many react in the same seconds. Liquidity can be thin around the release, so spreads widen and moves can be sharp in either direction.
Sources
- Institute for Supply Management (ISM), ISM PMI Reports (accessed 27 October 2026): the Manufacturing PMI is released on the first business day of each month, and a reading above 50 percent indicates the manufacturing economy is generally expanding, below 50 percent that it is generally contracting. https://www.ismworld.org/supply-management-news-and-reports/reports/ism-pmi-reports/
- US Bureau of Labor Statistics, The Employment Situation: September 2026, 2 October 2026: released at 8:30 a.m. ET; nonfarm payrolls +29,000; unemployment rate 4.2%; average hourly earnings $37.81, up 0.1%; July and August payrolls revised. https://www.bls.gov/news.release/empsit.nr0.htm
- US Bureau of Labor Statistics, Employment Situation Technical Note (accessed 27 October 2026): the establishment survey samples about 119,000 businesses and government agencies and excludes agricultural workers, the unincorporated self-employed, unpaid family workers and private household workers; the household survey samples about 60,000 households; the unemployment rate is the number unemployed as a percent of the labor force; the prior two months are routinely revised. https://www.bls.gov/news.release/empsit.tn.htm
- US Bureau of Labor Statistics, Schedule of Releases for The Employment Situation: next releases 6 November and 4 December 2026 at 8:30 a.m. https://www.bls.gov/schedule/news_release/empsit.htm
- US Bureau of Labor Statistics, Consumer Price Index: September 2026, 14 October 2026: the CPI measures the change in prices paid by consumers for goods and services; released at 8:30 a.m. ET; all items +0.6% m/m seasonally adjusted and +3.7% over 12 months; all items less food and energy +0.3% and +2.6%. https://www.bls.gov/news.release/cpi.nr0.htm
- US Bureau of Economic Analysis, Gross Domestic Product, 30 September 2026: GDP is a comprehensive measure of US economic activity, measuring the value of the final goods and services produced in the United States; reported at an annualized rate. https://www.bea.gov/data/gdp/gross-domestic-product
- US Bureau of Economic Analysis, Gross Domestic Product Release: Additional Information (accessed 27 October 2026): advance, second and third estimates near the end of the first, second and third months after the quarter. https://bea.gov/index.php/news/gdp-release-additional-information
- Board of Governors of the Federal Reserve System, Meeting calendars and information: eight regularly scheduled FOMC meetings a year; 2026 dates. https://www.federalreserve.gov/monetarypolicy/fomccalendars.htm
- Board of Governors of the Federal Reserve System, What economic goals does the Federal Reserve seek to achieve through its monetary policy?, last updated 22 August 2025: Congress assigned the Fed the goals of maximum employment and stable prices. https://www.federalreserve.gov/faqs/what-economic-goals-does-federal-reserve-seek-to-achieve-through-monetary-policy.htm
- National Institute of Standards and Technology (NIST), Daylight Saving Time (accessed 27 October 2026): US daylight saving time begins the second Sunday of March and ends the first Sunday of November. https://www.nist.gov/pml/time-and-frequency-division/popular-links/daylight-saving-time-dst
Practise what you learned
Open an account to use MetaTrader 5. Start on a demo account before risking real money.
Open Account