
RSI: What the Relative Strength Index Shows, Plus Stochastic
RSI, the Relative Strength Index, is a momentum oscillator that compares the size of recent gains with recent losses on a 0 to 100 scale. A reading above 70 shows strong recent buying force, and in a strong trend RSI can hold above 70 for long stretches.
Module 7 · Lesson 2 of 5
What you'll learn
- What RSI measures and how it is calculated, with a worked example.
- What the 70 and 30 levels describe, and why RSI can stay above 70 in a trend.
- What divergence and failure swings show about momentum.
- How the stochastic oscillator is built, how it differs from RSI, and how to add both in MetaTrader 5.
What is RSI?
RSI, the Relative Strength Index, is a momentum oscillator that compares the size of recent price gains with recent price losses and shows the result on a scale from 0 to 100. A high reading means recent gains outweighed recent losses; a low reading means the reverse.
MetaTrader 5's help page on the Relative Strength Index notes that when Wilder introduced RSI, he recommended 14 periods, and that 9-period and 25-period versions have also become popular. A period is one candle, so RSI(14) on a daily chart covers 14 days.
What is momentum?
Momentum is how forcefully price has been moving, measured by the size of recent moves. Force is not direction: a market can rise with less force than before and still be rising.
How is RSI calculated?
RSI is calculated in two steps: divide the average gain by the average loss over the period to get RS, then turn RS into a 0 to 100 scale with RSI = 100 − 100 ÷ (1 + RS). Gains and losses are the changes from one closing price to the next.
- Average gain: the average size of the up-closes over the period.
- Average loss: the average size of the down-closes, written as a positive number.
MetaTrader 5 writes the same formula as RSI = 100 − (100 / (1 + U / D)), with U the average positive change and D the average negative change. Platforms can average slightly differently, so their values can differ a little.
Worked example: RSI from synthetic averages
Take a synthetic 14-period RSI on EURUSD where the average gain is 12 pips and the average loss is 8 pips.
| Step | Calculation | Result |
|---|---|---|
| 1. RS | 12 ÷ 8 | 1.5 |
| 2. 1 + RS | 1 + 1.5 | 2.5 |
| 3. 100 ÷ (1 + RS) | 100 ÷ 2.5 | 40 |
| 4. RSI | 100 − 40 | 60 |
Check it backwards: RSI 60 means 100 ÷ (1 + RS) = 40, so RS = 1.5, which is 12 ÷ 8. Equal gains and losses give RS 1 and RSI 50; no losses at all give RSI 100.
What do 70 and 30 mean on RSI?
The 70 and 30 lines are reference levels: MetaTrader 5's help notes that RSI usually tops above 70 and bottoms below 30. Traders often call a reading above 70 overbought and below 30 oversold. Both words describe recent force, not price value, so traders read them together with the trend.
Why can RSI stay overbought in a trend?
RSI can stay above 70 in a strong uptrend because each new candle keeps adding more gains than losses to the average. The reading stays high for as long as the buying force lasts, which can be many candles. Overbought describes a strong trend, not one that is ending.
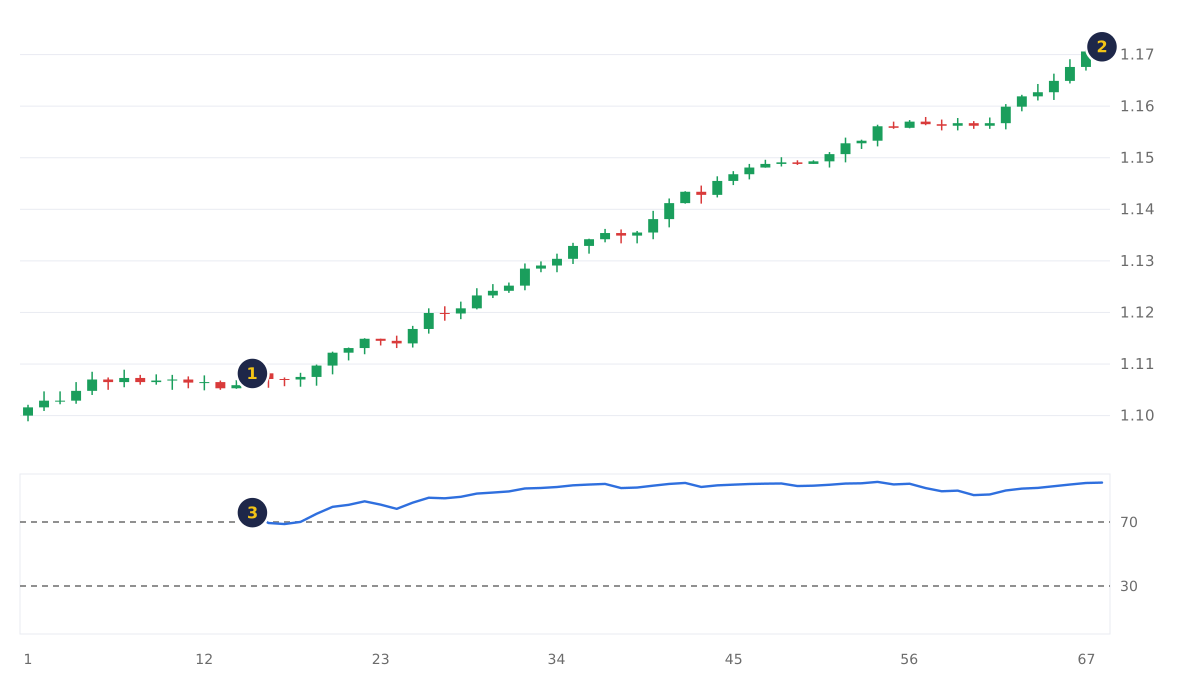
- Price at the chart's first RSI reading, a close of 1.1082.
- Price at the last candle, a close of 1.1715: 633 pips higher.
- That first RSI reading, about 76. RSI dipped just under 70 twice, then stayed above it. Of 54 readings, 52 were above 70.
On 0.10 lot of EURUSD, where a pip is worth about $1 (see the lots, pips and pip value lesson), a 633-pip move is 633 × $1 = $633. A trader who read the first reading as a reason to sell would have been on the wrong side of all 633 pips; the reading was right about momentum, describing a strong uptrend that kept going. The pip value calculator works this out for other pairs and sizes. Reading trend structure first puts a high RSI in context.
What is RSI divergence?
RSI divergence is when price and RSI disagree: price makes a higher high while RSI makes a lower high (bearish divergence), or price makes a lower low while RSI makes a higher low (bullish divergence). It describes a second push that had less force behind it than the first, so traders wait for price to confirm a turn.
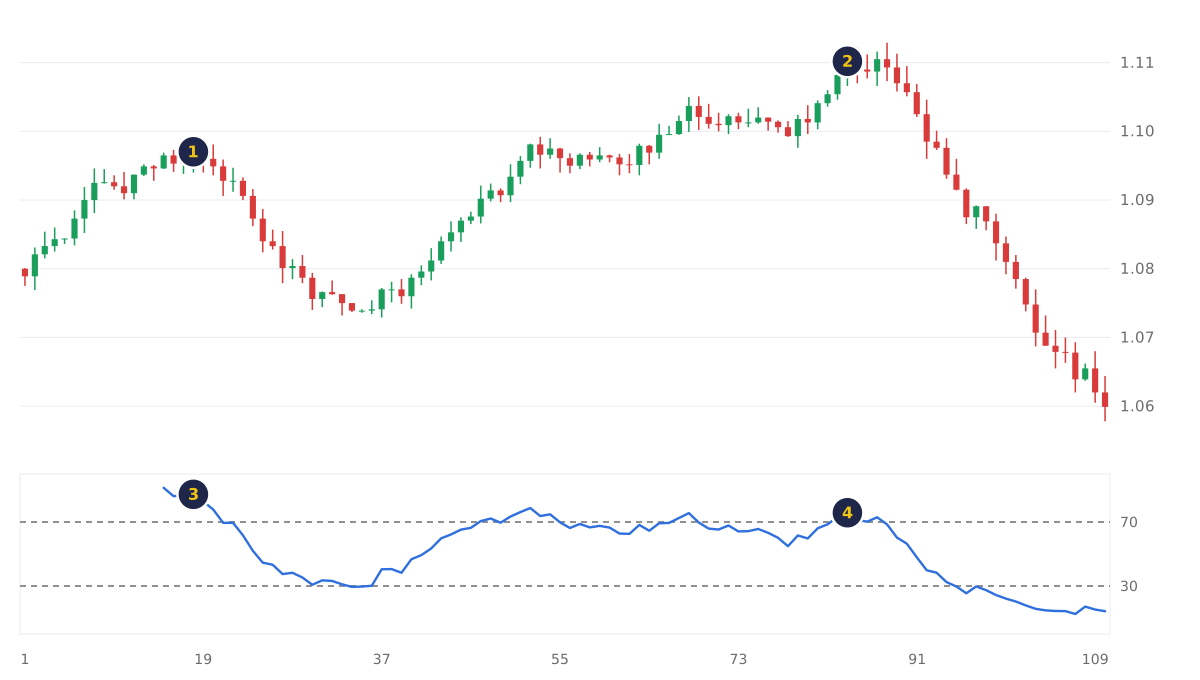
- First peak, a close of 1.0970.
- Second peak, a close of 1.1102: 132 pips higher.
- RSI at the first peak: about 87.
- RSI at the second peak: about 76. A higher price high on weaker momentum.
Here price did fall, but only after edging up for a few more candles to a high of 1.1129. Weakening momentum comes first and the price turn follows, sometimes many candles later. That is why traders pair divergence with price confirmation, and set risk with position size and a stop-loss.
What is an RSI failure swing?
A failure swing is when RSI turns down and falls below its own most recent trough. MetaTrader 5's RSI help lists it among the RSI signals used in chart analysis. Like divergence, it marks a change in momentum that traders confirm with price action.
What is the stochastic oscillator?
The stochastic oscillator measures where the latest close sits inside the highest high and lowest low of a recent period, on a 0 to 100 scale. A close at the top of the range reads 100; at the bottom, 0.
According to MetaTrader 5's Stochastic Oscillator help page:
- %K = (close − lowest low) ÷ (highest high − lowest low) × 100, over the %K period.
- %D = a moving average of %K, over the %D period. It is the slower line.
- Slowing smooths %K: 1 gives a fast stochastic, 3 a slow one.
Worked example with a synthetic 14-period range on EURUSD: highest high 1.0900, lowest low 1.0800, close 1.0875. %K = (1.0875 − 1.0800) ÷ (1.0900 − 1.0800) × 100 = 0.0075 ÷ 0.0100 × 100 = 75. Recompute: the close is 75 pips above the low of a 100-pip range, and 1.0800 + 0.0075 = 1.0875.
MetaTrader 5's help uses 80 and 20 as example levels. A high reading means price closed near the top of its recent range.
What is the difference between RSI and stochastic?
RSI compares the size of recent gains with recent losses, while stochastic compares the latest close with the recent high-low range. Both use a 0 to 100 scale but answer different questions, so they can disagree. RSI uses only closing prices; stochastic also uses highs and lows.
| RSI | Stochastic oscillator | |
|---|---|---|
| Question it answers | How large were recent gains versus losses? | Where did price close inside its recent range? |
| Inputs | Closing prices | Close, highest high, lowest low |
| Lines | One | Two: %K and %D |
| Reference levels in MT5 help | Tops above 70, bottoms below 30 | 80 and 20, as examples |
| In a strong trend | Can stay high or low for many candles | Can sit at the edge of its range for many candles |
How do you add RSI and stochastic in MetaTrader 5?
In MetaTrader 5, open Insert, then Indicators, then Oscillators, and choose Relative Strength Index or Stochastic Oscillator; you can also drag either one from the Navigator window onto the chart. MetaTrader 5's indicator help covers both methods. Either indicator opens in a separate window under the price chart.
- Open a chart and pick a timeframe.
- Go to Insert, Indicators, Oscillators, and choose the indicator.
- Set the period and click OK.
- To change settings later, right-click the line and choose Properties.
How do traders get the most from RSI and stochastic?
Traders get the most from RSI and stochastic by reading them inside the trend, confirming divergence with price, keeping settings fixed while they test, and pairing them with a tool that measures something else. Both are built from recent prices, so they are sharpest when the trend and price structure give them context.
- Read levels in context. In an uptrend, readings above 70 confirm strength; overbought and oversold can persist through a whole trend.
- Confirm divergence with price. Weaker momentum can come well before a turn, so wait for price to break structure.
- Keep settings fixed. Test one period across many charts instead of tuning it until one chart looks right.
- Give each tool its own job. RSI and stochastic both measure momentum, so pair one of them with a trend or volatility tool.
Combining indicators that measure different things is covered later in this module, in the lesson on using multiple indicators.
Try it on demo
On a demo account in MetaTrader 5, add RSI(14) to a D1 chart of a major pair that has been trending. Count the candles RSI stays above 70 or below 30, and how far price moved meanwhile. Then add a stochastic and note where the two disagree.
This lesson is part of the Forex Indicators module.
Quick check
- An RSI reading above 70 tells you that
- Average gain is 12 pips and average loss is 8 pips. What is RSI?
- In a strong uptrend, RSI can stay above 70 for
- Bearish divergence means
- The stochastic oscillator measures
Frequently asked questions
What is the best RSI setting?
The standard RSI setting is 14 periods, the one Wilder recommended, and 9 and 25 are also popular, according to MetaTrader 5's help. A shorter period reacts faster; a longer one is smoother.
What does an RSI of 50 mean?
An RSI of 50 means average gains and average losses over the period were equal, so RS is 1. It is the midpoint of the scale and describes balanced momentum, not a direction.
Does RSI work on every timeframe?
Yes, RSI can be calculated on any timeframe, because it only needs closing prices. The period changes meaning with the timeframe: RSI(14) on an M15 chart covers 14 fifteen-minute candles, about three and a half hours, while on D1 it covers 14 days.
Which is better, RSI or stochastic?
Each answers a different question, so choose the one that fits the job. RSI compares the size of recent gains with losses, while stochastic shows where the close sits in the recent high-low range.
Sources
- MetaQuotes, MetaTrader 5 Help: Relative Strength Index, accessed 19 October 2026: RSI ranges from 0 to 100; Wilder recommended 14 periods, with 9 and 25 also popular; RSI usually tops above 70 and bottoms below 30; divergence as a popular method; failure swing as RSI turning down below its most recent trough, listed among RSI signals used in chart analysis; formula RSI = 100 − (100 / (1 + U / D)). https://www.metatrader5.com/en/terminal/help/indicators/oscillators/rsi
- MetaQuotes, MetaTrader 5 Help: Stochastic Oscillator, accessed 19 October 2026: %K and %D lines, %K formula, %D as a moving average of %K, slowing of 1 (fast) or 3 (slow), and 80 and 20 as example levels. https://www.metatrader5.com/en/terminal/help/indicators/oscillators/so
- MetaQuotes, MetaTrader 5 Help: Technical Indicators, accessed 19 October 2026: indicators are added by dragging from the Navigator or with Insert, Indicators; oscillators such as MACD draw in a separate window; settings change through Properties. https://www.metatrader5.com/en/terminal/help/charts_analysis/indicators
Practise what you learned
Open an account to use MetaTrader 5. Start on a demo account before risking real money.
Open Account