
Technical Analysis: Price Structure and Chart Patterns
Module 6
Lessons in this module
- 1Trend lines and channels8 min
A trend line is a straight line joining two or more swing lows in an uptrend, or swing highs in a downtrend. It maps the slope price is moving at and the points where it has turned, giving traders a reference for entries, stops and breaks.
- 2Reversal patterns8 min
Chart patterns are repeating shapes in price, such as head and shoulders and double tops, that traders use to read when a trend is stalling and to plan entries, stops and measured moves at clear levels.
- 3Continuation patterns8 min
A flag pattern is a short pause after a sharp price move, made of a steep pole and a small channel that drifts against it. Traders read it as a continuation pattern and use the pole’s height to project a measured move.
- 4Breakouts and fakeouts8 min
Breakout trading means opening a position when price closes beyond a level that had held it, such as support, resistance, a trend line or a pattern edge. A false breakout, or fakeout, is the same break quickly reversed, and traders use closes, retests and a stop set in advance to manage both.
About this module
Technical analysis is the study of past price movement on a chart, such as trends, support and resistance and recurring shapes, to plan where a trade's entry, stop and target sit. Traders use it to structure every decision: where an idea starts, where it is proven wrong and how far a move can run.
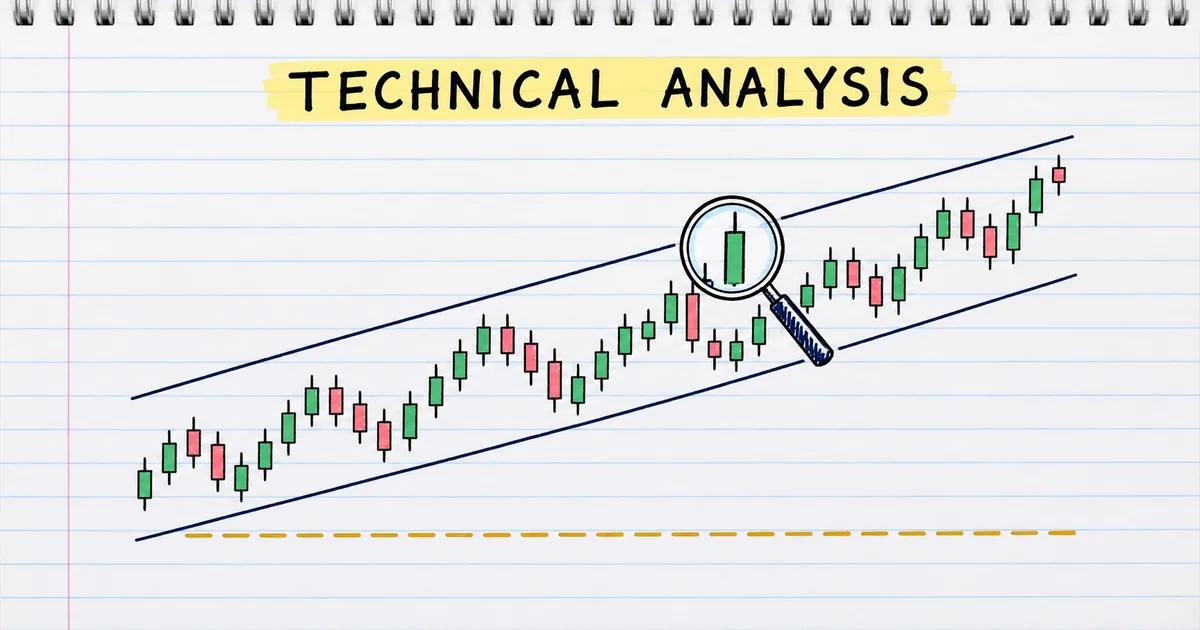
This module covers price structure, the part of technical analysis that uses price alone. You learn how to draw trend lines and channels, how chart patterns such as head and shoulders and double tops are defined, how continuation patterns such as flags, pennants and triangles are measured, and how to tell a breakout from a false breakout.
You need the Beginner chart skills first: candlesticks, timeframes, trends and ranges, and support and resistance, covered in Module 4, Reading Price Charts. Indicators, which are calculated from price, follow in Module 7.
What is technical analysis?
Technical analysis is reading past price movement on a chart to judge direction and decide where a trade's entry, stop loss and target sit. Price-only tools such as trend lines, support and resistance and chart patterns give the structure, and indicators calculated from price add confirmation. The technical indicators module covers those.
How do technical and fundamental analysis differ?
Technical analysis studies price on a chart, while fundamental analysis studies the economic data and news behind price. Technical tools show where to enter and exit; fundamental analysis explains why a market moves. Many traders use both, for example checking the economic calendar before acting on a chart setup.
How do you do technical analysis in forex?
To do technical analysis in forex, you mark the trend on a higher timeframe, draw the support and resistance levels price has respected, then wait for a pattern or breakout at one of those levels to set the entry, stop and target. The same steps work on any pair and any timeframe.
A worked example on EURUSD: the daily chart is rising, and on the 4-hour chart price runs from 1.0800 to 1.0920, a 120-pip pole, then drifts down to 1.0860 in a small bull flag. A close above the flag at 1.0900 is the trigger. Entry 1.0905, stop 1.0855 below the flag low (50 pips), and a target of 1.1020 from the 120-pip pole added to the 1.0900 breakout: 115 pips, a reward about 2.3 times the risk. The continuation patterns lesson shows how the measured move is worked out.
Does technical analysis work in forex?
Technical analysis works as a way to plan trades, not to predict every move: it marks where an idea is proven wrong, so the stop loss and position size are set before you enter. Its levels matter partly because many traders watch the same ones, and results depend on testing a method over many trades.
A pattern fails some of the time, which is why the breakouts and fakeouts lesson treats the false break as part of the plan, and why every setup in this module comes with a stop. Size each trade with the position size calculator so a failed pattern is a small, planned loss.
What do traders ask about technical analysis?
Traders ask four things first about technical analysis: which tools to start with, whether indicators are needed, which timeframe to use and how it relates to price action trading. The answers below each stand alone, with links to the lessons that cover them.
What are the basic tools of technical analysis?
Support and resistance, trend lines, chart patterns and candlesticks are the price-only tools; indicators such as moving averages and RSI are calculated from price. Start with support and resistance and trend lines, then add candlestick patterns, Fibonacci retracement and supply and demand zones.
Do you need indicators for technical analysis?
No. Price structure alone gives an entry, a stop and a target. Many traders add one or two indicators for confirmation, each doing a different job, as the using multiple indicators lesson shows.
Which timeframe is best for technical analysis?
No single timeframe is best. The daily and 4-hour charts show cleaner structure and leave time to plan, while lower timeframes give more signals and more noise. Most traders read a higher timeframe for direction and a lower one for entry, which the multi-timeframe analysis lesson explains.
Is technical analysis the same as price action trading?
Price action trading is one form of technical analysis that reads bare candles, levels and structure without indicators. The price action trading guide covers it, and Elliott wave theory is another way of reading the same structure.
Practise what you learned
Open an account to use MetaTrader 5. Start on a demo account before risking real money.
Open Account