
Reading Price Charts: How to Read Forex Charts
Module 4
Lessons in this module
- 1Candlestick anatomy8 min
A candlestick chart shows price as a row of candles, each recording the open, high, low and close of one time period. To read it, check each candle’s colour, body and wicks. The body shows where price started and finished, and the wicks show the highest and lowest prices traded in between.
- 2Chart timeframes9 min
A chart timeframe is the time each candle covers, so each H1 candle shows one hour of price and each D1 candle shows one day. Changing the timeframe changes the detail you see, never what the market did.
- 3Trends and ranges8 min
Market structure in forex is the pattern of swing highs and lows: higher highs and lows mean an uptrend, lower ones a downtrend, and flat ones a range. Traders read it on one timeframe to judge direction before planning a trade.
- 4Support and resistance8 min
Support and resistance are price areas where a market has repeatedly stopped falling (support) or stopped rising (resistance). Traders draw them as zones rather than exact lines and use them to plan entries, stops and targets.
- 5Types of charts8 min
The main types of trading charts are line, bar and candlestick charts, which MetaTrader 5 draws for every symbol, plus Heikin Ashi and Renko, which redraw price to smooth out noise. This lesson shows the same EURUSD hours on each type and when each one helps.
About this module
To read a forex chart, you read each candlestick's open, high, low and close for the chosen timeframe, then step back to see whether price is trending or ranging and where it has repeatedly turned. A chart records where buyers and sellers agreed on a price over time, clearly enough to plan a trade's entry and risk.
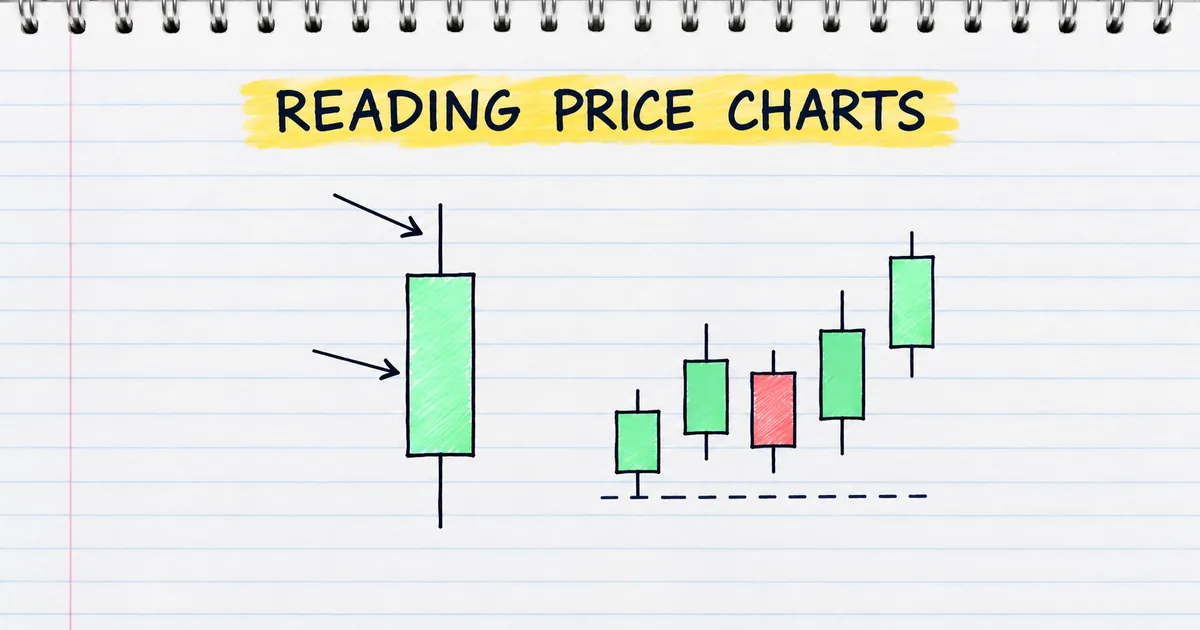
In this module you learn the anatomy of a candlestick, what chart timeframes mean and how the same market can look different on each, how to tell a trending market from a ranging one, how support and resistance levels form, and how the types of trading charts (line, bar, candlestick, Heikin Ashi and Renko) show the same prices. Each lesson uses worked examples on a simple price series, and you can practise every skill on free charts in MetaTrader 5.
You should know your way around MetaTrader 5 first, which is covered in Module 3, MetaTrader 5 Basics. Patterns, trend lines and indicators build on these basics later in the course.
How do you read a forex chart step by step?
Read a forex chart in four steps: choose the timeframe, read the latest candles for direction and strength, decide whether price is trending or ranging, then mark the support and resistance levels where it has turned before. Each step is one lesson in this module.
- Choose the timeframe. Each candle covers one period, from 1 minute to 1 month. See chart timeframes.
- Read the candles. The body and wicks show who controlled the period. See candlestick anatomy.
- Find the structure. Higher highs and higher lows make an uptrend; flat highs and lows make a range. See trends and ranges.
- Mark the levels. Prices where the market turned more than once. See support and resistance.
What do the numbers on a forex chart mean?
On a forex chart, the right-hand scale is the exchange rate, the bottom scale is time, and each candle shows the open, high, low and close for one period of the chosen timeframe. MetaTrader 5 charts show the bid price by default.
A worked example: a 1-hour EURUSD candle opens at 1.0850, reaches 1.0872, dips to 1.0841 and closes at 1.0866. It is bullish because it closed above its open. The body is 16 pips (1.0866 − 1.0850), the full range 31 pips (1.0872 − 1.0841), the upper wick 6 pips and the lower wick 9 pips. A long lower wick shows buyers pushed price back up within the hour.
What is chart analysis?
Chart analysis is reading a price chart to judge direction, strength and key levels, so a trade's entry, stop loss and target are based on where price has actually traded. It is the starting point of technical analysis, which adds patterns and indicators in later modules.
The same prices can be drawn in several ways, which the types of trading charts lesson compares. After this module, Module 6, Technical Analysis adds trend lines and chart patterns, and the candlestick patterns guide collects the common candle signals.
What do beginners ask about reading charts?
Beginners ask four things first about reading trading charts: what green and red candles mean, which timeframe to start on, where to find free charts and how long it takes to learn. The answers below each stand alone, with links to the lessons that cover them.
What do green and red candles mean?
A green (bullish) candle closed higher than it opened, and a red (bearish) candle closed lower. The colours are a setting, not a rule: you can change them in MetaTrader 5, so always read the open and close rather than the colour. See bullish vs bearish.
Which timeframe should beginners start on?
The daily and 4-hour charts. Each candle carries more information and the chart moves slowly enough to read calmly. Lower timeframes show more noise, as the chart timeframes lesson explains.
Where can you get free forex charts?
In MetaTrader 5. A free demo account gives live charts for every symbol, with all timeframes, drawing tools and built-in indicators. Installing MetaTrader 5 takes a few minutes.
How long does it take to learn to read charts?
The basics in this module take a few hours to read. Reading charts quickly comes with practice: marking trends and levels on a few charts each day for a few weeks builds the habit faster than reading more theory.
Practise what you learned
Open an account to use MetaTrader 5. Start on a demo account before risking real money.
Open Account