
Candlestick Chart: What It Is and How to Read One
A candlestick chart shows price as a row of candles, each recording the open, high, low and close of one time period. To read it, check each candle’s colour, body and wicks. The body shows where price started and finished, and the wicks show the highest and lowest prices traded in between.
Module 4 · Lesson 1 of 5
What you'll learn
- What a candlestick chart is and the four prices each candle shows.
- How to tell the body from the wicks, and a bullish candle from a bearish one.
- How to measure a candle in pips and in money.
- How candlestick, bar and line charts differ, and how to switch between them in MetaTrader 5.
What is a candlestick chart?
A candlestick chart shows price as a row of candles, where each candle sums up the trading in one period of time, such as one hour or one day. Each candle shows four prices: open, high, low and close. A green or hollow candle usually closed above its open; a red or filled candle closed below it.
That period is the chart's timeframe. MetaTrader 5's help describes a timeframe as the time of one bar or candlestick, and lists this chart type by its full name, Japanese candlesticks. On a one-hour (H1) chart, every candle is one hour. Timeframes are covered in the chart timeframes lesson. This lesson opens the Reading Price Charts module.
What do open, high, low and close mean?
Open, high, low and close, often shortened to OHLC, are the four prices every candle records for its period.
- Open: the first price of the period.
- High: the highest price traded during the period.
- Low: the lowest price traded during the period.
- Close: the last price of the period. On the candle still forming, it is the latest price and keeps changing until the period ends.
What are the parts of a candlestick?
A candlestick has two parts: the body, the thick block between the open and the close, and the wicks, the thin lines above and below it that reach the high and the low. Wicks are also called shadows. The body shows the net move over the period. The wicks show how far price travelled beyond that before the period ended.
- Upper wick: from the top of the body up to the high.
- Lower wick: from the bottom of the body down to the low.
- Range: from the low to the high, the full distance price covered.
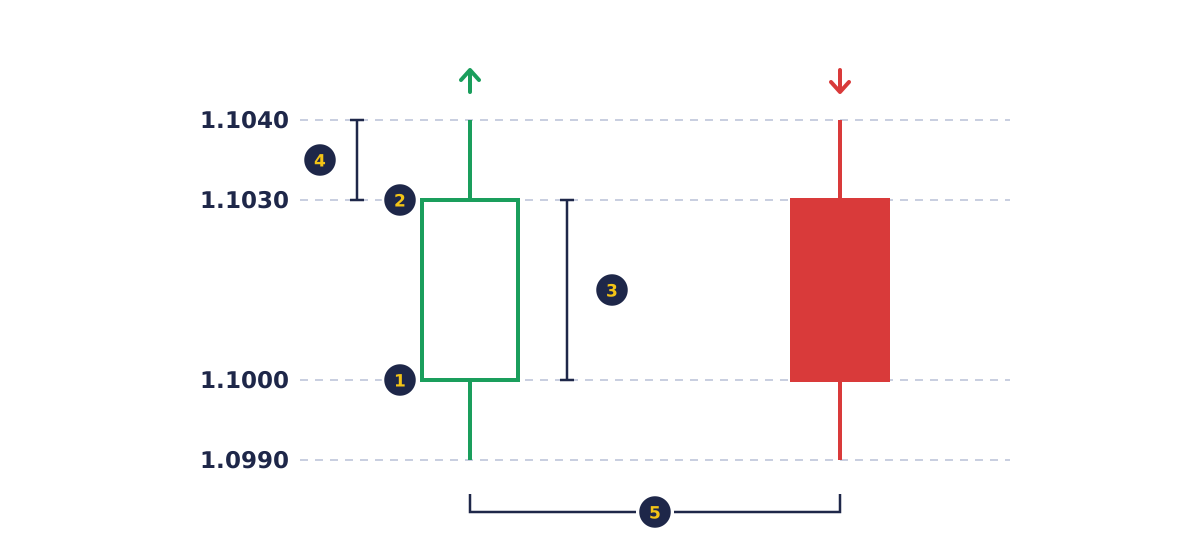
- Callouts 1 and 2: the bullish candle opens at 1.1000 and closes at 1.1030.
- Callouts 3 and 4: its 30-pip body, and the upper wick up to the high of 1.1040. The low is 1.0990.
- Callout 5: a bearish candle on the same levels, opening at 1.1030 and closing at 1.1000.
What separates a bullish candle from a bearish candle?
A bullish candle closes above its open, so price finished the period higher; a bearish candle closes below its open, so price finished lower. The body's colour shows which is which. If the open and close are equal, the candle has almost no body.
| Bullish candle | Bearish candle | |
|---|---|---|
| Close compared with open | Above the open | Below the open |
| Bottom of the body | The open | The close |
| Top of the body | The close | The open |
| Common default style | Green or hollow | Red or filled |
Colours are a chart setting, not a rule: MetaTrader 5 lets you choose the bull candle and bear candle colours.
How do you read a candlestick chart step by step?
To read a candlestick chart, check the symbol and timeframe, read each candle's direction, body and wicks, then look at several candles in a row. One candle describes one period of trading. A sequence of candles describes how price moved across many periods.
- Check the symbol and timeframe. The same market can look very different on an M5 and a D1 chart.
- Find the direction. Is the close above the open (bullish) or below it (bearish)?
- Read the body and wicks. See the table below for what each shape describes.
- Read the sequence. Are the highs and lows getting higher, getting lower, or staying in a band? That leads into the next lessons, on trends and ranges and support and resistance.
What do long and short bodies and wicks show?
Bodies and wicks show how a period was traded: how far price moved, and where it settled by the close.
| Shape | What it describes about that period |
|---|---|
| Long body, short wicks | Price closed well away from its open, near the high or the low |
| Short body, long wicks | Price moved both ways but closed near the open |
| Long upper wick | Price traded higher, then fell back before the close |
| Long lower wick | Price traded lower, then rose back before the close |
| Close near the high or the low | Price finished the period near that end of its range |
Long and short are relative. Compare a candle with the candles just before it on the same chart and timeframe, not with a fixed number of pips.
A candlestick pattern is a named shape made by one or more candles, such as the doji. The most common ones are listed below. Traders read them together with the trend and nearby price levels.
What are the most common candlestick patterns?
The most common candlestick patterns are the pin bar, hammer and shooting star (single candles with one long wick) and the engulfing and morning star (two or three candles in a row). They are named chart-reading conventions that traders use to describe how a turn in price took shape.
For how to read each one in context and plan an entry, stop and target from it, see candlestick patterns and how to trade them.
| Pattern | Candles | What it looks like |
|---|---|---|
| Pin bar | 1 | One long wick and a small body at the other end. The general long-wick shape |
| Hammer | 1 | Small body near the top and a long lower wick, after a decline; after a rise, the same shape is a hanging man |
| Shooting star | 1 | Small body near the low and a long upper wick, after a rise |
| Engulfing candle | 2 | The second body fully covers the first body and closes in the opposite direction |
| Morning star | 3 | A long bearish candle, a small-bodied candle, then a long bullish candle that closes up into the first body |
As with bodies and wicks, long and small are judged against nearby candles. Traders do not all agree on the exact rules, so check how a source defines a pattern before comparing examples.
Heikin Ashi is not a pattern but a different candle calculation: each candle is built from averaged prices, so its open and close are not actual traded prices.
How do you measure a candle in pips?
To measure a candle in pips, subtract one price from another and divide by the pip size, which is 0.0001 for most pairs such as EURUSD. Do this for the body (open to close), each wick and the full range (low to high).
Worked example: a one-hour EURUSD candle opens at 1.08500, reaches a high of 1.08720, falls to a low of 1.08410 and closes at 1.08650. The close is above the open, so it is bullish.
| Part | Calculation | Size |
|---|---|---|
| Body | 1.08650 − 1.08500 | 15 pips |
| Upper wick | 1.08720 − 1.08650 | 7 pips |
| Lower wick | 1.08500 − 1.08410 | 9 pips |
| Range | 1.08720 − 1.08410 | 31 pips |
The parts add up to the range: 15 + 7 + 9 = 31 pips. On EURUSD, 0.10 lot is worth about $1 per pip, so that hour's range equals about $31 of movement on a 0.10 lot position. The lots, pips and pip value lesson explains pip values, and the pip value calculator works them out for other pairs.
How do candlestick, bar and line charts differ?
Candlestick and bar charts both show all four prices for each period, while a line chart shows only the closes joined together. All three are drawn from the same price history. MetaTrader 5 describes its line chart as a broken line that connects close prices of bars.
| Candlestick chart | Bar chart | Line chart | |
|---|---|---|---|
| Prices shown | Open, high, low, close | Open, high, low, close | Close only |
| Open and close | Ends of a coloured body | Small ticks on the side of each bar | Close only |
| Direction at a glance | Easy, by body colour | Harder, compare the ticks | From the line's slope |
| MetaTrader 5 hotkey | Alt+2 | Alt+1 | Alt+3 |
Heikin Ashi and Renko charts, and when each chart type helps, are compared in types of trading charts.
How do you switch chart type in MetaTrader 5?
In MetaTrader 5, press Alt+2 for candlesticks, Alt+1 for bars or Alt+3 for a line chart. You can also change it from the Charts menu, the chart's right-click menu or the chart properties window, according to the MetaTrader 5 help on charts.
- Open a EURUSD chart from Market Watch. The MetaTrader 5 platform tour shows where Market Watch is.
- Press Alt+2 for candlesticks.
- Press F8 for chart properties: the Show tab turns on the OHLC line, and the Colors tab sets candle colours.
- Press Ctrl+D for the Data Window, then point at a candle to read its exact prices.
Which price are MetaTrader 5 candles built from?
MetaTrader 5 builds its bars and candles from the Bid price, the price you sell at. The chart settings help notes that symbols with depth of market use the Last price instead. Buy orders open at the Ask, which is higher by the spread, so the Ask can reach a level no candle shows. The spread is explained in the spread, commission and swap lesson.
What do skilled traders check when reading candlesticks?
Before acting on a candle, skilled traders check three things: whether it has closed, which timeframe it belongs to, and how much money its range represents at their position size. A closed candle is a fixed record of its period. The forming candle is still live, and news can move it sharply before the close.
- Has the candle closed? The current candle's close, body and colour keep changing until the period ends.
- Which timeframe? One H1 candle holds four M15 candles, which may look quite different.
- What is the range in money? A 31-pip hour on 0.10 lot is about $31 of movement. Position sizing is covered in Module 5, Risk Management.
Try it on demo
On a MetaTrader 5 demo account, open a EURUSD H1 chart and press Alt+2. Open the Data Window with Ctrl+D and write down the open, high, low and close of three finished candles. Work out each body, both wicks and the range in pips, and check that the parts add up.
Quick check
- What do the letters OHLC stand for?
- A candle opens at 1.20000 and closes at 1.20500. It is
- The thin lines above and below a candle's body are called the
- A candle has a long upper wick. That tells you
- On EURUSD, a candle's high is 1.08720 and its low is 1.08410. Its range is
Frequently asked questions
What do green and red candles mean?
On most charts, a green candle closed above its open (bullish) and a red candle closed below its open (bearish). Some charts use hollow and filled bodies instead, and colours are a chart setting, so check your own chart.
What does a long wick on a candle mean?
It means price reached that level during the period and then moved back before the close, so the level was rejected within that period. Traders read it together with the trend and nearby support and resistance.
What does each candle on a candlestick chart represent?
Each candle represents the trading in one period of the chart's timeframe. On an H1 chart each candle is one hour; on a D1 chart each candle is one day.
Is a candlestick chart better than a line chart?
For reading price action, a candlestick chart gives more information: it shows the open, high, low and close of each period, while a line chart shows only the closes. A line chart is useful for a quick, simple view of direction.
What does a doji candle mean?
A doji is a candle whose open and close are equal or almost equal, so it has little or no body. It shows that price moved during the period but finished where it started.
Sources
- MetaQuotes, MetaTrader 5 Help: View and Configure Charts, accessed 19 October 2026: charts can be shown as bars, Japanese candlesticks or a broken line; the chart type can be changed from the Charts menu, the chart context menu or the chart properties; a timeframe is the time of one bar or candlestick; charts are built from Bid prices, or Last prices when depth of market is available. https://www.metatrader5.com/en/terminal/help/charts_analysis/charts
- MetaQuotes, MetaTrader 5 Help: Chart Settings, accessed 19 October 2026: bar, candlestick and line chart types, with the line connecting close prices of bars; the OHLC line shows bar open, high, low and close; bull candle and bear candle body colours are user settings; bars are formed based on Bid prices, or Last prices when depth of market is available. https://www.metatrader5.com/en/terminal/help/charts_advanced/charts_settings
- MetaQuotes, MetaTrader 5 Help: Hot Keys, accessed 19 October 2026: Alt+1 bar chart, Alt+2 candlesticks, Alt+3 line chart, F8 chart properties, Ctrl+D Data Window. https://www.metatrader5.com/en/terminal/help/start_advanced/hotkeys
Practise what you learned
Open an account to use MetaTrader 5. Start on a demo account before risking real money.
Open Account