
Hammer Candlestick
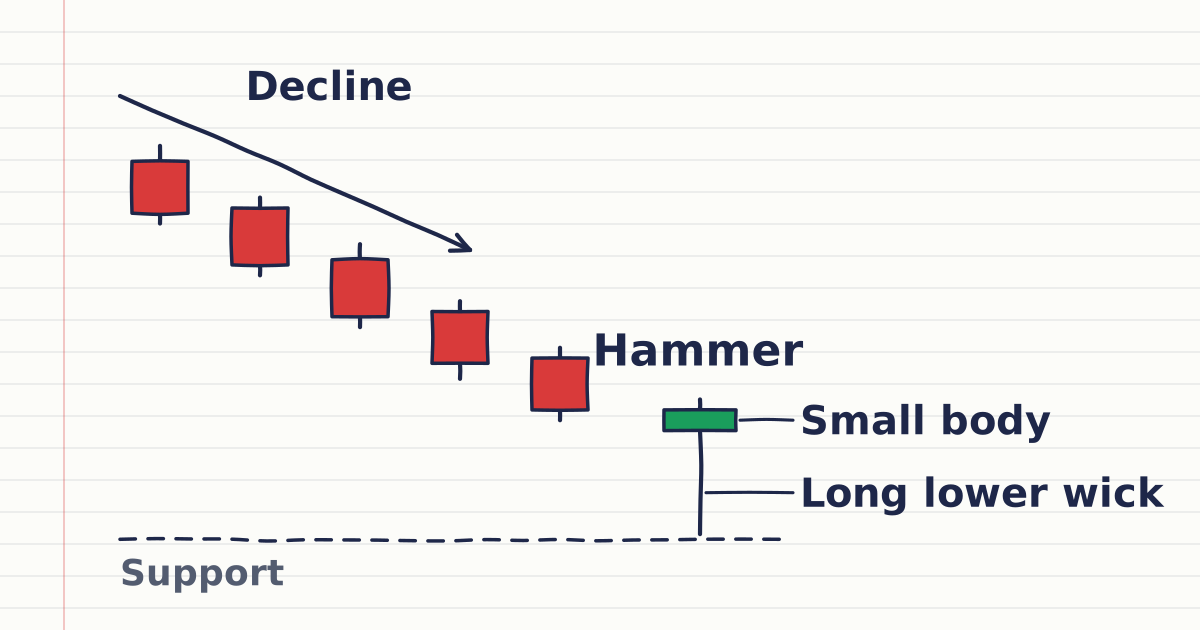
A hammer candlestick is a candle with a small body near the top and a long lower wick, seen after a decline, showing price fell sharply and then recovered.
A hammer candlestick is a candle with a small body near the top of its range and a long lower wick, appearing after a price decline. The shape shows that price traded much lower during the period, then moved back up to close near where it opened.
The name is a chart-reading convention with no official definition, so thresholds vary between traders.
How do you spot a hammer?
You spot a hammer by three features: a small body in the upper part of the candle, a lower wick at least twice the body, and little or no upper wick. It must also come after a decline. The parts of a candle (body, wicks, open, close) are covered in how to read a candlestick chart.
MetaTrader 5 can show the chart as Japanese candlesticks. A hammer is usually described with three features:
- A small body in the upper part of the candle.
- A lower wick much longer than the body, often described as at least twice its length.
- Little or no upper wick.
The body can be bullish or bearish. A candle with almost no body is closer to a doji, and a similar long-wick shape is also called a pin bar.
Worked example. USDZAR falls over several hourly candles to about 18.2000. One H1 candle opens at 18.2000, drops to a low of 18.1500, then closes at 18.2100, with a high of 18.2150. The body is 100 pips (18.2100 minus 18.2000), the lower wick is 500 pips and the upper wick is 50 pips. The lower wick is five times the body, so the candle has a hammer shape. Chart readers treat a later close above the hammer's high (18.2150) as confirmation, and a close below its low (18.1500) as cancelling it.
What candles look like a hammer?
Three candles look like a hammer: the hanging man, the inverted hammer and the shooting star, told apart by wick position and the trend before them. The hanging man has the same shape after a rise. The inverted hammer flips the shape after a decline, and the shooting star flips it after a rise.
In detail:
- Hanging man: the same shape as a hammer, but after a rise instead of a decline. Only the preceding trend differs.
- Inverted hammer: a small body near the bottom and a long upper wick, after a decline. It is the hammer flipped upside down.
- Shooting star: the same flipped shape as the inverted hammer, but after a rise. See the shooting star candlestick.
What is an inverted hammer candlestick?
An inverted hammer candlestick is a hammer turned upside down: a small body near the bottom of the candle, a long upper wick at least twice the body, and little or no lower wick, appearing after a decline. It shows buyers pushed price well up during the period, but it closed back near the open.
Worked example. After a fall in USDZAR, an H1 candle opens at 18.1500, rises to 18.2000, dips to 18.1450 and closes at 18.1550. The body is 50 pips (18.1550 minus 18.1500), the upper wick 450 pips (18.2000 minus 18.1550) and the lower wick 50 pips. The upper wick is nine times the body, so the candle has an inverted hammer shape. Chart readers look for the next candles to close above its body as confirmation; a close below its low (18.1450) cancels it. The same shape after a rise is a shooting star.
Why does context matter for a hammer candle?
Context matters because a hammer and a hanging man look identical, and only the trend before the candle tells you which one you are seeing. Traders read a hammer with the decline before it (trends and ranges), a nearby support level and the next candle's close, and check the same period on a higher timeframe.
How do you find a hammer in MetaTrader 5?
MetaTrader 5 has no built-in hammer feature, so you read the shape yourself on a candlestick chart and check the candle's prices. Press Alt+2 for candlesticks, and open the Data Window with Ctrl+D to read a candle's exact open, high, low and close.
Body colours are user settings, and candles are built from Bid prices unless market depth is available.
Does a hammer mean price will reverse?
No: a hammer describes one finished period in which price fell and then recovered to close near its open, not a reversal. The turn is confirmed by the candles after it, such as a close above the hammer's high. A close below the hammer's low cancels the shape.
Sources
- MetaQuotes, MetaTrader 5 Help: Chart Settings, accessed 19 October 2026: candlestick chart type, bull and bear candle colours as settings, bars formed from Bid prices. https://www.metatrader5.com/en/terminal/help/charts_advanced/charts_settings
- MetaQuotes, MetaTrader 5 Help: View and Configure Charts, accessed 19 October 2026: price charts can be shown as Japanese candlesticks; Bid prices are used for charts, Last prices when market depth is available. https://www.metatrader5.com/en/terminal/help/charts_analysis/charts
- MetaQuotes, MetaTrader 5 Help: Hot Keys, accessed 19 October 2026: Alt+2 shows candlesticks, Ctrl+D opens the Data Window. https://www.metatrader5.com/en/terminal/help/start_advanced/hotkeys
Practise what you learned
Open an account to use MetaTrader 5. Start on a demo account before risking real money.
Open Account