
Morning Star Candlestick
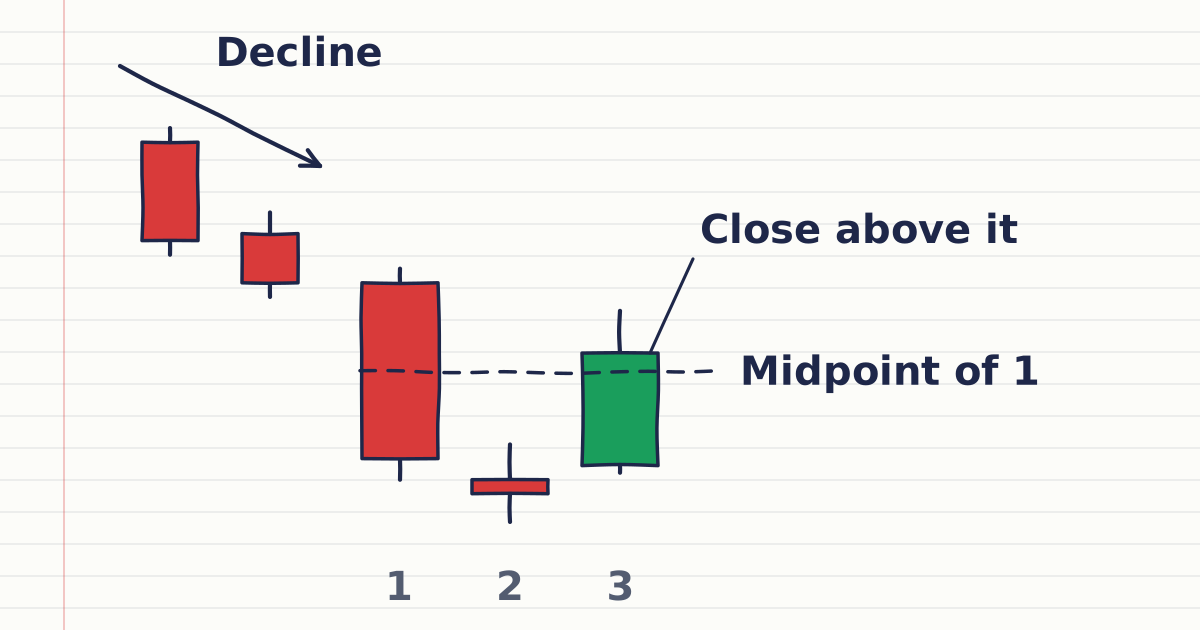
A morning star is a three-candle chart pattern made of a long bearish candle, a small-bodied candle, then a long bullish candle that closes up into the first candle’s body.
A morning star candlestick is a pattern made of three candles in a row: a long bearish candle, a small-bodied candle, and a long bullish candle. The third candle closes up inside the body of the first. Traders read it as a bullish reversal at the end of a decline.
New to candles? Start with how open, high, low and close make a candle's body and wicks.
How do you spot a morning star?
You spot a morning star by finding three candles in a row after a decline: a long bearish candle, a small-bodied candle, and a long bullish candle closing into the first body. Look for them in this order on the same chart and timeframe:
- A long bearish candle. It closes below its open, and its body is large compared with the candles just before it.
- A small-bodied candle. Price barely moves between open and close. It can be bullish, bearish or a doji.
- A long bullish candle. It closes above its open, and its close lands inside the body of the first candle. Many readers want it past the midpoint of that body.
Long and small are relative: compare each candle with its neighbours, not with a fixed pip size.
What is an evening star?
The evening star is the mirror image: a long bullish candle, a small-bodied candle, then a long bearish candle that closes down into the first candle's body. Traders read it as a bearish reversal at the end of a rise, and give it more weight when the third candle closes past the midpoint of the first body.
Worked example: morning star on USDZAR
Three daily USDZAR candles:
| Candle | Open | High | Low | Close | Body |
|---|---|---|---|---|---|
| 1 (bearish) | 18.4000 | 18.4200 | 18.1200 | 18.1500 | 0.2500 |
| 2 (small) | 18.1200 | 18.1700 | 18.0600 | 18.1000 | 0.0200 |
| 3 (bullish) | 18.1400 | 18.3600 | 18.1300 | 18.3000 | 0.1600 |
The first body runs from 18.1500 to 18.4000, so its midpoint is 18.2750. Candle 3 closes at 18.3000, above that midpoint and inside the first body, so the shape fits the description. A 0.1600 move means one US dollar changed by 0.16 units of the quote currency. A $1,000 buy at the 18.3000 close with the stop below the pattern's low at 18.0600 loses 240 units of the quote currency (0.2400 × 1,000), about $13.29 at 18.0600, if the stop is hit; a rise of the same 0.2400 to 18.5400 gains 240, about $12.94.
How do you find a morning star in MetaTrader 5?
MetaTrader 5 has no morning star label, so you find one by reading three candles in a row on a candlestick chart. MetaTrader 5 can show a chart as a sequence of candlesticks, and the hotkey is Alt+2. Press Ctrl+D to open the Data Window and read each candle's exact prices.
In the chart properties you can set the bull candle and bear candle colours.
What do traders get wrong about the morning star?
The common mistake is treating any three candles of the right colours as a morning star, wherever they appear on the chart. Location matters. Traders look for it after a clear decline, ideally at a support level, and give it more weight when the third candle closes past the midpoint of the first.
The pattern is complete only when the third candle closes. Readers often pair it with other shapes such as an engulfing candle.
Sources
- MetaQuotes, MetaTrader 5 Help: View and Configure Charts, accessed 19 October 2026: charts can be shown as a sequence of bars, Japanese candlesticks or a broken line. https://www.metatrader5.com/en/terminal/help/charts_analysis/charts
- MetaQuotes, MetaTrader 5 Help: Chart Settings, accessed 19 October 2026: bull candle and bear candle body colours are chart settings. https://www.metatrader5.com/en/terminal/help/charts_advanced/charts_settings
- MetaQuotes, MetaTrader 5 Help: Hot Keys, accessed 19 October 2026: Alt+2 shows candlesticks and Ctrl+D opens the Data Window. https://www.metatrader5.com/en/terminal/help/start_advanced/hotkeys
Practise what you learned
Open an account to use MetaTrader 5. Start on a demo account before risking real money.
Open Account