
Heikin Ashi
Heikin Ashi is a candlestick chart style that recalculates each candle from averaged prices, giving smoother-looking candles whose open and close are not actual traded prices.
Heikin Ashi is a way of drawing candlesticks in which each candle is calculated from averaged prices instead of plotted from the raw open, high, low and close. MetaQuotes describes the result as synthetic candlesticks that differ from standard ones. The spelling "Heiken Ashi" is also common.
How is a Heikin Ashi candle calculated?
A Heikin Ashi candle closes at the average of the normal open, high, low and close, and opens halfway between the previous Heikin Ashi open and close. Its high and low take the extremes of the real prices and those two values. HA means the Heikin Ashi value.
MetaQuotes lists the Heiken-Ashi formulas below. Open, High, Low and Close are the normal candle's prices for the same period.
- HA close = (Open + High + Low + Close) / 4
- HA open = (previous HA open + previous HA close) / 2
- HA high = the highest of High, HA open and HA close
- HA low = the lowest of Low, HA open and HA close
The candlestick anatomy lesson explains the four normal prices.
Worked example: Heikin Ashi on USDZAR
The previous USDZAR Heikin Ashi candle had an HA open of 18.1000 and an HA close of 18.1400. The current one-hour normal candle opened at 18.1300, reached 18.1900, fell to 18.1100 and closed at 18.1700.
- HA close = (18.1300 + 18.1900 + 18.1100 + 18.1700) / 4 = 18.1500
- HA open = (18.1000 + 18.1400) / 2 = 18.1200
- HA high = highest of 18.1900, 18.1200 and 18.1500 = 18.1900
- HA low = lowest of 18.1100, 18.1200 and 18.1500 = 18.1100
The normal candle has a body of 0.0400 (18.1300 to 18.1700). The Heikin Ashi candle has a body of 0.0300 (18.1200 to 18.1500). Both are bullish, but the HA open and close are averages, and USDZAR never traded at either.
How is Heikin Ashi different from a normal candle?
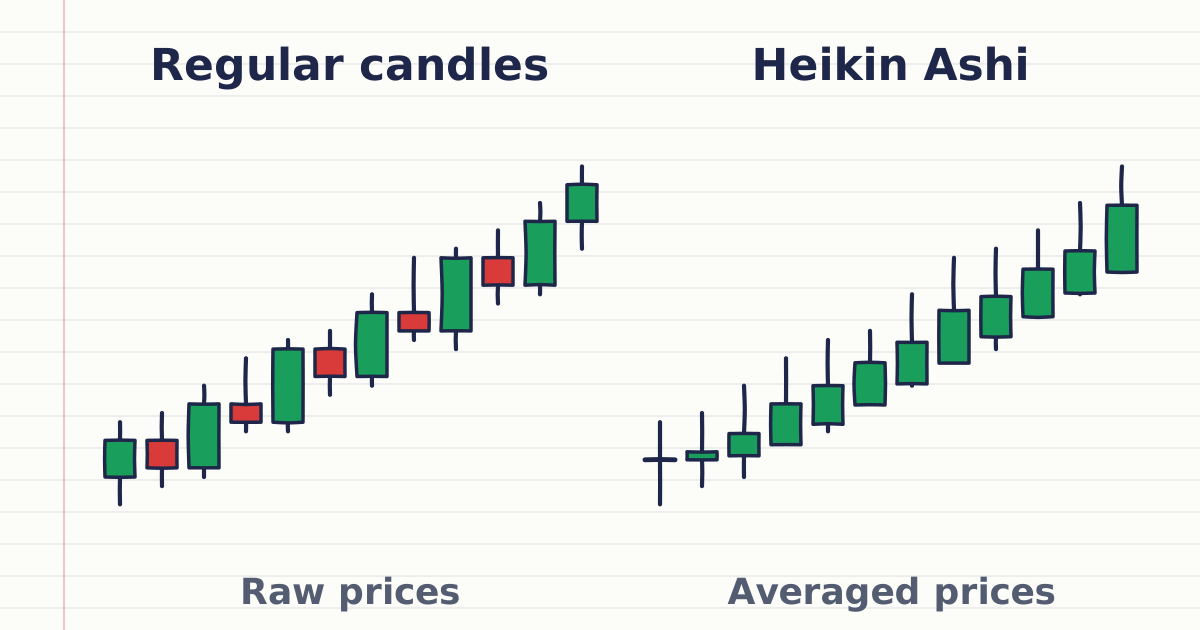
A normal candle plots prices that traded, while a Heikin Ashi candle replaces the open and close with averages, so it looks smoother and trails price. Averaging makes runs of same-colour candles look tidier than on a normal chart. It trails price because each HA open mixes in the previous candle, as the formulas show.
Traders use it to read trend direction: a run of bullish HA candles with no lower wicks reads as a strong uptrend, and the first candle of the opposite colour marks the run slowing.
The bullish and bearish entry explains candle colours. The doji is a normal-candle shape, so judge it on a normal chart.
How do you add Heikin Ashi in MetaTrader 5?
You add Heikin Ashi in MetaTrader 5 with the Heiken-Ashi indicator, which MetaQuotes publishes in the MQL5 Code Base. Look for Heiken_Ashi in the Navigator window's indicator list; if it is not there, download MetaQuotes' version from the Code Base. Then follow these two steps.
- Drag it from the Navigator onto the chart, or use Insert, Indicators.
- To stop the normal candles covering the Heikin Ashi ones, switch the chart to a line chart and turn off Chart in foreground in the chart properties.
What do traders get wrong about Heikin Ashi?
The common mistake is reading a Heikin Ashi open or close as a price that actually traded. Its open and close are calculated, so a level read from one may never have traded. Read the trend on Heikin Ashi, then switch back to normal candles to set entries and stops at prices that actually traded.
Sources
- MetaQuotes, Heiken-Ashi indicator for MetaTrader 5 (MQL5 Code Base), accessed 19 October 2026: the HA close, open, high and low formulas; synthetic candlesticks that differ from standard ones; author MetaQuotes. https://www.mql5.com/en/code/33
- MetaQuotes, MetaTrader 5 Help: Technical Indicators, accessed 19 October 2026: indicators are applied from the Navigator window or the Insert, Indicators command. https://www.metatrader5.com/en/terminal/help/charts_analysis/indicators
- MetaQuotes, MetaTrader 5 Help: Chart Settings, accessed 19 October 2026: the Line chart type connects close prices of bars; the Chart in foreground setting. https://www.metatrader5.com/en/terminal/help/charts_advanced/charts_settings
Practise what you learned
Open an account to use MetaTrader 5. Start on a demo account before risking real money.
Open Account