
Bullish vs Bearish: Meaning in Trading, With Candle Examples
Bullish describes a view that prices will rise or a move in which they have risen; bearish describes a view that prices will fall or a move in which they have fallen.
Bullish means prices are expected to rise or have risen, while bearish means prices are expected to fall or have fallen. The words are labels for a direction, used for a person's view, for a market, for a trend or for a single candle.
In a trade, a bullish view is acted on by buying (going long) and a bearish view by selling (going short).
What is the difference between bullish and bearish?
Bullish and bearish are opposites: bullish points to rising prices and bearish to falling prices. The same pair of words describes a trader's view, a whole market, a trend of swing highs and lows, or one candle. A bullish trader buys to gain from a rise; a bearish trader sells to gain from a fall.
| Bullish | Bearish | |
|---|---|---|
| Price direction | Rising, or expected to rise | Falling, or expected to fall |
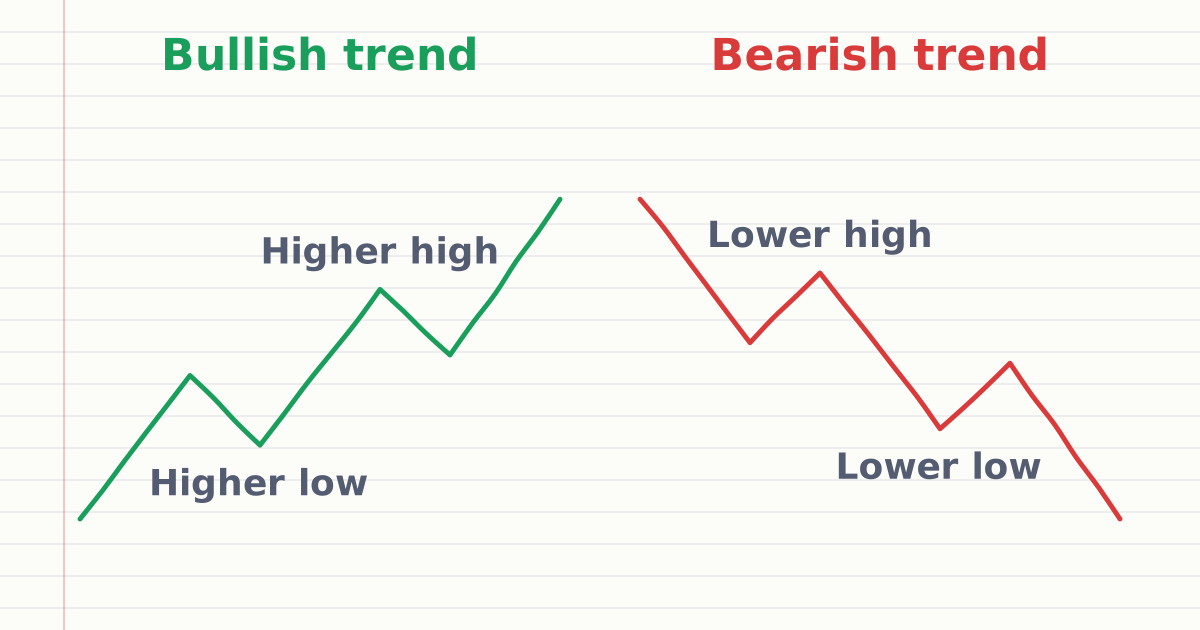
| Trend structure | Higher highs and higher lows | Lower highs and lower lows |
| Candle | Closes above its open | Closes below its open |
| Market mood | Optimistic | Pessimistic |
| Position that gains | Buy (long) | Sell (short) |
| Market name | Bull market | Bear market |
What do bullish and bearish mean for a market?
For a whole market, bullish and bearish describe both the mood and the recent direction of prices. A bull market is a period of rising prices and optimism; a bear market is a period of falling prices and pessimism. For stock indices, a common rule of thumb is a move of 20% or more over at least two months.
The US Securities and Exchange Commission's investor site defines a bull market as a time when prices are rising and sentiment is optimistic, and a bear market as a time when prices are declining and sentiment is pessimistic. Those definitions, and the 20% rule, are written for stock markets. In forex, traders usually say a pair is in a bullish or bearish trend instead.
What do they mean for a trend?
A trend is bullish when swing highs and swing lows keep stepping higher, and bearish when they keep stepping lower. A range is neither: price moves sideways between two levels. Reading the swings, not one candle, is how traders call a trend bullish or bearish.
Reading those swings is covered in how to tell a trending market from a ranging market. A close beyond the last swing in the trend's direction is often labelled a break of structure.
What do they mean for a single candle?
A candle is bullish if it closed above its open and bearish if it closed below its open. That is a fact about one period that has already ended, such as one hour on an H1 chart. It says nothing on its own about the next candle.
Some named patterns, such as the hammer candlestick and the engulfing candle, are described as bullish or bearish, but those are chart-reading conventions with no official definition. The candlestick patterns guide covers the common ones, and how to read a candlestick explains the open, high, low and close.
Worked example. On an H1 chart, USDZAR opens at 18.1000 and closes at 18.2500. The close is above the open, so the candle is bullish for USDZAR. Read from the other side, the same move means the quote currency bought fewer dollars, so it is bearish for that currency. For a pair, bullish always refers to the first currency against the second.

How do you see bullish and bearish candles in MetaTrader 5?
MetaTrader 5 can draw bars, Japanese candlesticks or a line, and in candlestick mode bullish and bearish candles each get their own colour. In the chart properties, bull candle and bear candle each have their own colour setting, so check which colour your chart uses before reading it.
How do traders use bullish and bearish?
Traders use bullish and bearish as labels for direction: either a view they act on by buying or selling, or a record of what price has already done. Bullish on EURUSD is a view that it will rise, acted on by buying; bearish is the opposite, acted on by selling. A bullish candle is not a forecast.
At 0.10 lot of EURUSD, about $1 per pip, a long position gains about $40 if price rises 40 pips and loses about $40 if it falls 40 pips; a short position does the reverse. The going long and short lesson shows both sides step by step, and a free MT5 demo account lets you practise both.
Frequently asked questions
Is bullish good or bad?
Neither. Bullish only means rising or expected to rise. It is good for a buyer and bad for a seller of the same instrument, and a bullish view on USDZAR is a bearish view on its quote currency.
What is the difference between a bull market and a bear market?
A bull market is a period of rising prices and optimism, and a bear market a period of falling prices and pessimism. For stock indices, a rough rule is a 20% move over at least two months.
Can you make money in a bearish market?
A falling price can be traded by selling (going short), which gains if the price falls and loses if it rises. With forex and CFDs you can sell as easily as buy, so a bearish view can be acted on with a sell order.
Sources
- U.S. Securities and Exchange Commission, Investor.gov, Bull Market, accessed 19 October 2026: a time when prices are rising and sentiment is optimistic; generally a rise of 20% or more in a broad index over at least two months. https://www.investor.gov/introduction-investing/investing-basics/glossary/bull-market
- U.S. Securities and Exchange Commission, Investor.gov, Bear Market, accessed 19 October 2026: a time when prices are declining and sentiment is pessimistic; generally a fall of 20% or more in a broad index over at least two months. https://www.investor.gov/introduction-investing/investing-basics/glossary/bear-market
- MetaQuotes, MetaTrader 5 Help: View and Configure Charts, accessed 19 October 2026: charts can be shown as bars, Japanese candlesticks or a broken line. https://www.metatrader5.com/en/terminal/help/charts_analysis/charts
- MetaQuotes, MetaTrader 5 Help: Chart Settings, accessed 19 October 2026: bull candle and bear candle body colours are separate chart settings. https://www.metatrader5.com/en/terminal/help/charts_advanced/charts_settings
Practise what you learned
Open an account to use MetaTrader 5. Start on a demo account before risking real money.
Open Account