
Mean Reversion Strategy vs Breakout: How Each Approach Works
A mean reversion strategy is a set of trading rules built on the assumption that a price stretched far from its recent average tends to drift back toward it. A breakout approach assumes the opposite, that the stretch continues, so each depends on whether the market is ranging or trending.
Module 13 · Lesson 2 of 5
What you'll learn
- What a mean reversion strategy is, its main types, and how a z-score measures a stretch.
- What a breakout approach assumes, and how the two compare.
- Which market regime each approach needs, and how traders handle a regime change.
- How to test each approach before trading it.
Part of the Advanced Trading Strategies module. Breakouts and false breakouts are taught in the breakout trading lesson.
What is a mean reversion strategy?
A mean reversion strategy is a set of trading rules built on the assumption that a price stretched far from its recent average tends to drift back toward it. The rules define the average, how far counts as stretched, and where a position opens against the stretch and closes, including a stop loss.
Definitions
- Mean (average): usually a moving average of recent closes, such as the last 20.
- Standard deviation: how spread out recent closes are around that average; MetaTrader 5's Standard Deviation help calls it a measure of volatility.
- Z-score: how many standard deviations price sits from its average.
- Regime: the kind of market price is in: a range (sideways) or a trend (one direction).
How do you calculate a z-score for mean reversion?
Z-score = (price − average) ÷ standard deviation. A z-score of 0 means price is at its average; +2 means two standard deviations above it; −2 means two below. It turns "price looks stretched" into one number that can be compared across days, pairs and timeframes.
Synthetic example: EURUSD's 20-period average is 1.0850, the standard deviation of those closes is 0.0015, and price is 1.0880.
| Step | Calculation | Result |
|---|---|---|
| Distance from the average | 1.0880 − 1.0850 | 0.0030, or 30 pips |
| Z-score | 0.0030 ÷ 0.0015 | 2.0 |
A z-score of 2.0 sits on the upper Bollinger Band at its usual setting: MetaTrader 5's Bollinger Bands help builds the bands as a 20-period simple moving average plus and minus two standard deviations, and notes that prices tend to stay between them. The z-score tells you where price sits; your rules decide what you do there.
What types of mean reversion strategy are there?
Mean reversion strategies differ mainly in how they define the mean and measure the stretch: a moving average, Bollinger Bands, an oscillator such as RSI, or the gap between two related prices. Each assumes the stretch fades, so each fits a range and relies on a stop loss for the times price keeps trending.
| Type | How the stretch is measured | When the assumption fails |
|---|---|---|
| Moving average reversion | Distance from a moving average, often as a z-score | The average lags a new trend |
| Bollinger Band reversion | Closes beyond bands two standard deviations from the average | Price walks along one band in a trend |
| Oscillator reversion | RSI, a 0 to 100 scale that usually peaks above 70 and troughs below 30 | RSI can stay high or low while a trend runs |
| Pairs (spread) reversion | The gap between two related prices, such as two correlated currency pairs | The relationship breaks down |
What does a breakout approach assume?
A breakout approach assumes that when price moves beyond a level or band it had been held by, the move will continue. It opens a position in the direction of the stretch, not against it. Its rules define the level, what counts as a break, the exit and a stop loss.
John Bollinger's band rules describe closes outside the bands as initially continuation signals, not reversal signals, an idea behind many volatility breakout systems. So one close at z = 2.0 is read two opposite ways, and the market regime decides which reading fits.
Breakout vs mean reversion: what is the difference?
The difference between breakout and mean reversion approaches is the direction of the bet on a stretch: mean reversion positions against it, expecting a return to the average, while a breakout positions with it, expecting continuation. The regime each needs and where its losses come from follow from that.
| Mean reversion | Breakout | |
|---|---|---|
| Core assumption | A stretch from the average tends to fade | A break beyond a level tends to continue |
| Regime it needs | Range: price moves sideways between levels | Trend: price keeps moving one way |
| Position at a stretch | Against the move | With the move |
| Where losses come from | A stretch that becomes a trend | False breakouts that fall back inside the range |
| Typical risk shape | Frequent small moves back to the average, occasional large losses | Frequent small losses, results depending on a few long moves |
Which market regime does each approach assume?
A mean reversion approach assumes a range, where price keeps turning back between levels, and a breakout approach assumes a trend, where price keeps moving away. You can only label a regime from past price, using swing highs and lows as in the trends and ranges lesson, and traders re-check it as each new swing forms.
Volatility shifts every z-score too, because the standard deviation changes with it; see the volatility regimes lesson.
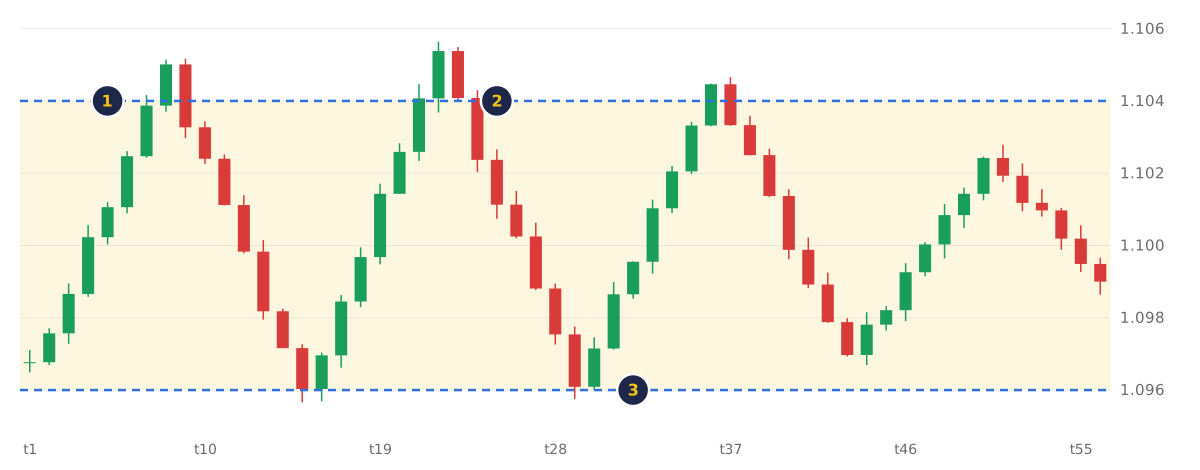
- Markers 1 and 2: the upper edge at 1.1040. Price closes above it three times, at about 1.1045 to 1.1054, and falls back inside each time.
- Marker 3: the lower edge at 1.0960, where price turns up twice.
- Buying those three closes met false breakouts; selling them met a return toward the middle.
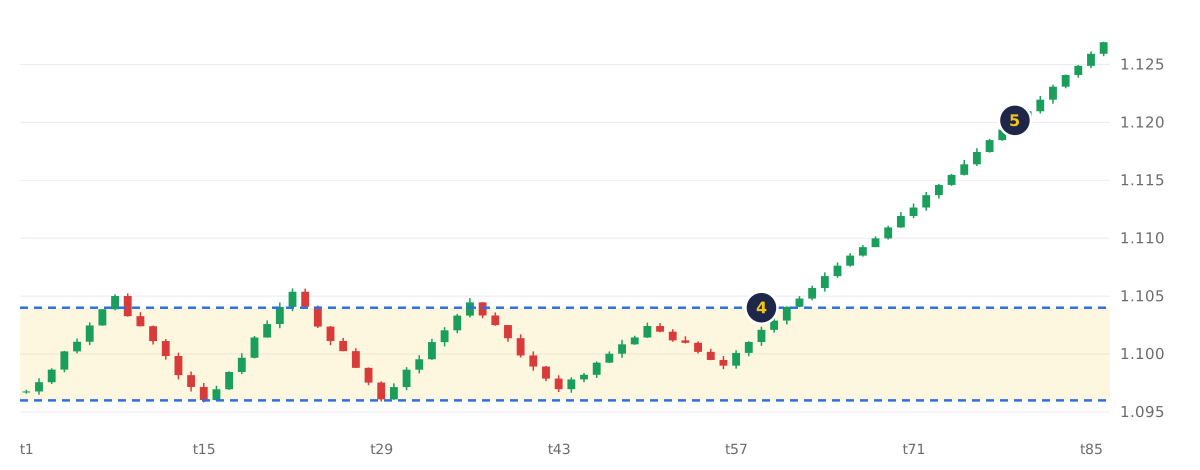
- Marker 4: the fourth break above 1.1040 looks the same as the first three when it happens.
- Marker 5: price near 1.1200 and still rising. Selling this break, as before, leaves a position roughly 150 pips against it.
What happens to each approach in the wrong regime?
In the wrong regime, each approach loses: a mean reversion position loses when the stretch keeps going, and a breakout position loses when price returns to the average. The same entry can produce opposite results, depending only on what the market does next.
Using the z-score example, price is 1.0880 (z = 2.0). Trader A sells 0.10 lot of EURUSD (mean reversion); Trader B buys 0.10 lot (breakout). One pip is worth about $1. Spread and swap are ignored.
| Outcome | Price moves to | Trader A (sell, mean reversion) | Trader B (buy, breakout) |
|---|---|---|---|
| Range: price returns to the average | 1.0850 | +30 pips × $1 = +$30 | −30 pips × $1 = −$30 |
| Trend: the stretch extends | 1.0920 | −40 pips × $1 = −$40 | +40 pips × $1 = +$40 |
Each loss comes in the regime that trader did not assume. The price of 1.0880 alone does not show which row comes next, so each trader sets the stop loss before entry.
For other pairs and sizes, use the pip value calculator.
How do traders handle a regime change?
Traders handle a regime change by building an exit and a regime check into the rules, because each approach keeps acting on its assumption after the market stops meeting it. Mean reversion keeps selling strength in a trend; a breakout rule keeps buying breaks in a range. A stop loss set before entry caps each of those losses.
- Mean reversion in a trend. Price can walk along a band, as Bollinger's rules note. A fixed stop loss, and a rule against adding to a losing position, keep the loss at its planned size.
- Breakout in a range. Each false break is stopped out, paying spread and slippage every time. Many breakout rules require a close beyond the level, or a trend on the higher timeframe, before acting.
- The mean itself moves. After a lasting change, such as a central bank policy shift, the old average stops marking where price settles.
- The switch itself. It shows only in hindsight, like the fourth break above, which is why the stop is placed at entry.
How do you control risk in breakout and mean reversion?
Risk in both approaches is controlled with a stop loss on every position, a position size worked out from that stop, and costs counted into the rules. Each approach has losing runs in the regime it does not fit, and sizing keeps every loss in that run at the planned amount.
- A stop on every position. A mean reversion position without a stop loss has no limit on how far price can keep going.
- Slippage. Entries and stops can fill worse than planned in fast markets, so the size leaves room for it.
- Costs. Every trade pays the spread; overnight positions pay or receive swap. Count both when testing the rules.
How can you test either idea before using it?
You can test either idea by writing exact rules, running them on past data, and then watching them on a demo account, keeping results separate by regime. Splitting the results by regime shows where the rules fit and where they need a filter.
- Write the rules: the average, the entry trigger, the stop loss and the exit.
- Run them on past data, as shown in the MetaTrader 5 strategy tester lesson.
- Record results separately for ranging and trending stretches.
- Run the same rules on demo for several weeks.
Try it on demo
On a demo account in MetaTrader 5, add Bollinger Bands (20, 2) to a EURUSD H4 chart. Find ten closes outside the bands and note whether price reached the middle line first or kept moving away. Label each case range or trend.
Quick check
- A mean reversion strategy assumes that
- Average 1.0850, standard deviation 0.0015, price 1.0880. The z-score is
- A breakout approach depends on the market
- Which risk shape is typical of a mean reversion approach?
- You sell 0.10 lot of EURUSD at 1.0880, at about $1 per pip. Price rises to 1.0920. The loss is about
Frequently asked questions
What is an example of a mean reversion strategy?
A common example is Bollinger Band reversion on EURUSD: when price closes beyond a band two standard deviations from its 20-period average, the trader positions for a move back toward the middle line, with a stop loss beyond the close and an exit at the average.
Which is better, breakout or mean reversion?
The better choice is the one that matches the current regime: mean reversion fits a range and breakouts fit a trend. Each loses in the other's regime, so traders label the regime first and then apply the matching rules.
What z-score do mean reversion traders use?
Many traders reference ±2, because it matches the usual Bollinger Band setting. The threshold is a rule choice to test on past data and on demo, and price can move well past it, so the stop loss still sets the risk.
What is the difference between mean reversion and trend following?
Mean reversion positions against a stretch, expecting a return to the average; trend following positions with an established direction, expecting it to continue. A breakout approach is one way to join a trend, so it shares trend following's need for a trending regime.
Sources
- MetaQuotes, MetaTrader 5 Help: Bollinger Bands, accessed 19 October 2026: the middle line is a 20-period simple moving average with the top and bottom lines two standard deviations away; the standard deviation formula; prices tend to remain between the top and bottom lines. https://www.metatrader5.com/en/terminal/help/indicators/trend_indicators/bb
- MetaQuotes, MetaTrader 5 Help: Standard Deviation, accessed 19 October 2026: standard deviation measures market volatility as the range of price fluctuations relative to a moving average; high values mean prices are spread out from the average, low values mean they stay close to it. https://www.metatrader5.com/en/terminal/help/indicators/trend_indicators/sd
- MetaQuotes, MetaTrader 5 Help: Relative Strength Index, accessed 19 October 2026: RSI = 100 − (100 ÷ (1 + U ÷ D)), ranges between 0 and 100, and usually tops above 70 and bottoms below 30. https://www.metatrader5.com/en/terminal/help/indicators/oscillators/rsi
- John Bollinger, Bollinger Band Rules, bollingerbands.com, accessed 19 October 2026: tags of the bands are not signals; in trending markets price can walk up the upper band and down the lower band; closes outside the bands are initially continuation signals, not reversal signals, an idea behind many volatility breakout systems. https://www.bollingerbands.com/bollinger-band-rules
Practise what you learned
Open an account to use MetaTrader 5. Start on a demo account before risking real money.
Open Account