
Geopolitical Risk: How Wars, Votes and Shocks Move Forex
Geopolitical risk is the threat that wars, conflicts, elections, sanctions or trade disputes disrupt markets, often moving currency prices sharply and without warning. Skilled traders do not forecast these shocks; they decide in advance how much exposure they hold when one arrives.
Module 12 · Lesson 5 of 5
What you'll learn
- What geopolitical risk is and how economists measure it.
- How geopolitical events affect forex markets, channel by channel.
- Why scheduled and unscheduled shocks need different preparation.
- How a price gap turns an $80 planned loss into $600, and how position size limits it.
What is geopolitical risk?
Geopolitical risk is the risk that wars, terrorism, conflicts between countries or major political events disrupt economies and markets. For a trader, it shows up as sudden, large price moves in currencies, gold, oil and stock indices, often at an unknown time and in a direction that is rarely clear in advance.
In everyday market use, the term covers a wide list:
- Wars and military conflict, including the threat of one.
- Terrorism and attacks on infrastructure.
- Sanctions, which restrict trade or payments with a country.
- Trade disputes, such as new tariffs.
- Elections and referendums, where a result can change a country's policy direction.
Economists draw the line more tightly: in June 2016 the Bank of England's Governor treated geopolitical, economic and policy uncertainty as three distinct types, so a referendum is closer to policy uncertainty. On a chart, both can look the same: a sudden repricing.
Definition: tail risk
Tail risk is the risk of a rare, severe move far outside normal day-to-day swings. Extreme, unexpected events of this kind are often called black swans, explained in our guide to black swan events.
How is geopolitical risk measured?
The best-known measure is the Geopolitical Risk (GPR) Index by Dario Caldara and Matteo Iacoviello, economists at the US Federal Reserve Board. It counts, each month, the share of articles in 10 leading US, UK and Canadian newspapers that discuss adverse geopolitical events and threats. Higher readings mean more press coverage of wars, terrorism and tensions between states.
Their Federal Reserve working paper defines geopolitical risk as the threat, realisation and escalation of adverse events tied to wars, terrorism and tensions between states. Key facts about the index:
| Feature | What it is |
|---|---|
| Source | Newspaper text, searched for word pairs such as a topic word ("war", "terrorism") plus a threat or act word |
| Frequency | Daily and monthly versions |
| Scale | The recent index is set to average 100 over 1985 to 2019 |
| Largest spikes since 1985 | The Gulf War, 9/11 and the 2003 invasion of Iraq |
| Historical version | Runs back to 1900, with spikes at the start of both world wars, the Korean War and the Cuban Missile Crisis |
| What higher readings went with | Lower investment and employment, and a higher chance of economic disasters |
The index measures press coverage of tension, which makes it a gauge of the backdrop rather than a direction call for any currency.
How do geopolitical events affect forex markets?
Geopolitical events affect forex markets mainly through four channels: risk-off flows, trade, commodity prices and capital controls. One event can work through several channels at once, pulling a currency in opposite directions, which is why traders map each channel before judging the net effect.
| Channel | How it works | Currencies often affected |
|---|---|---|
| Risk-off flows | Investors sell assets seen as risky and buy those seen as safer | Currencies seen as riskier, such as many emerging-market currencies, are often sold; the yen, Swiss franc and US dollar have tended to rise in risk-off episodes. More in risk-on and risk-off markets |
| Trade | Tariffs, sanctions or blockades change a country's exports and imports | Currencies of countries that depend heavily on the trade affected |
| Commodities | Conflict near supply routes can move oil, gas, metals or grain prices | Currencies of big commodity exporters and importers |
| Capital controls | A government restricts money leaving or entering the country | Prices for that currency can freeze, gap or become hard to trade |
The Bank of England said sterling's fall after the 2016 referendum reflected higher risk premia on UK assets: investors wanted more reward for holding them.
How do scheduled and unscheduled shocks differ?
A scheduled shock has a known date but an unknown outcome; an unscheduled shock has neither. Elections and referendums are scheduled, so you can decide your exposure days in advance. A sudden attack or surprise sanctions give no warning, so your normal position size is what controls the outcome.
| Feature | Scheduled event | Unscheduled shock |
|---|---|---|
| Examples | Election, referendum, treaty deadline | Military attack, terror attack, sudden sanctions |
| Date known? | Yes | No |
| Outcome known? | No | No |
| What you can control | Size before the date, or no position at all | Only the size you already hold |
Scheduled economic releases follow the same logic: see trading the news.
What happened to sterling after the 2016 EU referendum?
After the UK voted to leave the EU in its June 2016 referendum, sterling fell and stayed lower for months. The Bank of England reported that between 23 June and 1 July, the sterling exchange rate index fell by 9%, and short-term sterling volatility against the dollar hit its highest level in the post-Bretton Woods era of floating exchange rates.
On 24 June the Bank said it stood ready to provide more than £250bn of additional funds and expected some market volatility.
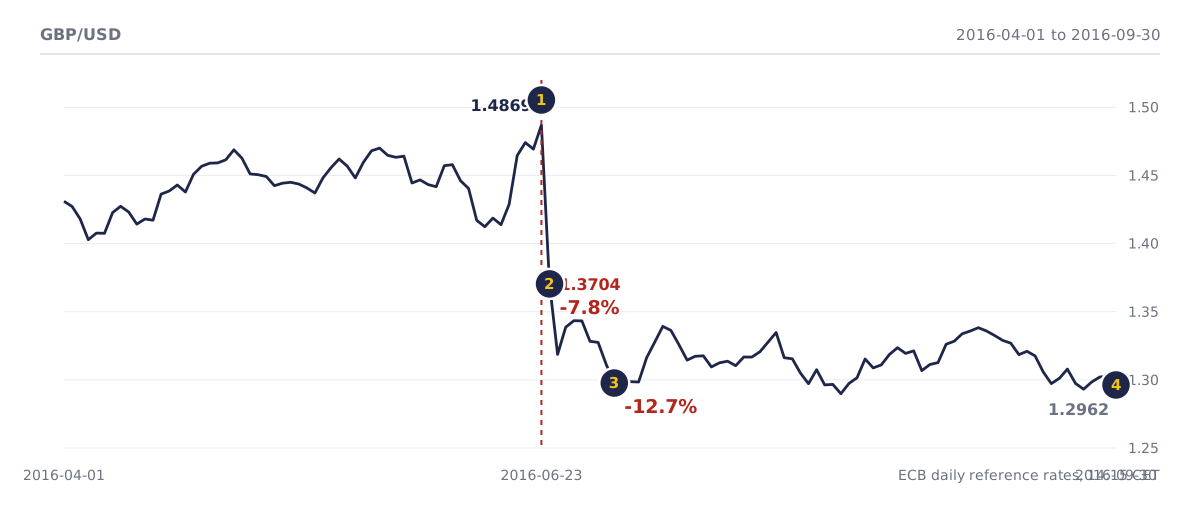
- The dashed line marks 23 June 2016, the vote date, at 1.4869. The date was known months ahead.
- On 24 June, the first rate after the result, GBP/USD is 1.3704, 7.8% lower.
- By 6 July it is 12.7% below the 23 June level: the move did not reverse.
- On 30 September it is 1.2962, still near that lower level.
The chart uses the European Central Bank's daily reference rates (dollars per euro divided by pounds per euro): one snapshot per business day, not traded prices.
How do you calculate the loss from a price gap?
Loss from a gap = the distance from your entry to the first available price, in pips × pip value per lot × lots. Your stop level drops out of the sum: once the price jumps past it, the stop fills at the next available price, as explained in news gaps and slippage.
Hypothetical example, synthetic numbers, on a $10,000 account. For GBPUSD, one standard lot is worth about $10 per pip, so 0.20 lot is $2 per pip.
- Plan: long 0.20 lot with a 40-pip stop. Planned risk: 40 × $2 = $80, or 0.8% of the account.
- Shock: news breaks while the market is closed, and the price reopens 300 pips below entry.
- Result: the stop fills at the first price, so the loss is 300 × $2 = $600, or 6% of the account.
Now the same event with a smaller position, 0.05 lot ($0.50 per pip):
| Position | Planned loss (40 pips) | Loss after a 300-pip gap | Share of $10,000 |
|---|---|---|---|
| 0.20 lot | $80 | $600 | 6% |
| 0.05 lot | $20 | $150 | 1.5% |
See our guide to forex lot sizes, or try the position size calculator.
How do traders prepare for geopolitical shocks?
Skilled traders prepare by sizing for the gap rather than the stop, because prices can jump past a stop loss when a shock hits. Spreads can widen, liquidity can thin and some markets can stop quoting, and a stop loss closes at the next available price rather than at a fixed level.
Practical controls, in order:
- Count your exposure. Add up every position in the currencies an event could hit.
- Size for the gap, not the stop. Ask what a 300-pip gap would cost at your size, as in the table above. The method is in position sizing.
- Cut size into known events. Reduce size, or hold no position, before the date.
- Check your account terms. In the EU, ESMA's 2018 measures require negative balance protection for retail CFD clients, which limits losses to the money in the account. Rules differ elsewhere.
The size of a shock is unknown in advance; your exposure is set by you.
Try it on demo
On a MetaTrader 5 demo account, open the GBPUSD daily chart and find the 24 June 2016 candle, if your broker's history goes back that far. Measure its high-to-low range in pips with the crosshair. Then work out what that distance would cost at 0.20 lot and at 0.05 lot, compared with a 40-pip stop.
This lesson is part of the Global Macro module.
Quick check
- The Federal Reserve Board's Geopolitical Risk Index is built from
- Which shock usually comes with a known date?
- You hold 0.20 lot of GBPUSD ($2 per pip) with a 40-pip stop. The price opens 300 pips against you. Before costs, the loss is about
- Before a known high-risk event, which change cuts the money at risk from a gap?
- Negative balance protection, where your account has it, means
Frequently asked questions
How do geopolitical events affect currencies?
Geopolitical events affect currencies by changing investors' appetite for risk, a country's trade, commodity prices and, in extreme cases, whether money can move freely. The same event can push one currency down and another up.
What is an example of geopolitical risk?
An example is the UK's 2016 EU referendum. The Bank of England reported that the sterling exchange rate index fell 9% between 23 June and 1 July 2016. Wars, sanctions and trade disputes are other common examples.
Can you trade geopolitical news?
Yes. Traders handle geopolitical news by sizing for the gap rather than the stop, since prices can jump past a stop when news breaks. For scheduled events such as elections they set exposure before the date; for unscheduled shocks their standing position size is the control.
What is the difference between political risk and geopolitical risk?
Geopolitical risk concerns relations between countries: wars, terrorism and tensions among states. Domestic political events, such as an election, sit closer to what the Bank of England calls policy uncertainty, a separate type, though both can move a currency.
What is the Geopolitical Risk Index?
The Geopolitical Risk Index is a measure built by two Federal Reserve Board economists from the share of newspaper articles about wars, terrorism and tensions between states. It has daily and monthly versions, and its recent version is set to average 100 over 1985 to 2019.
Sources
- Board of Governors of the Federal Reserve System, Dario Caldara and Matteo Iacoviello, Measuring Geopolitical Risk, International Finance Discussion Papers 1222r1, March 2022: definition of geopolitical risk; the GPR index counts the share of articles in 10 newspapers on adverse geopolitical events; daily and monthly versions; recent index normalised to 100 over 1985 to 2019; historical index back to 1900 spiking around both world wars, the Korean War and the Cuban Missile Crisis; largest recent spikes in the Gulf War, after 9/11 and in the 2003 Iraq invasion; higher GPR foreshadows lower investment and employment and higher disaster probability. https://www.federalreserve.gov/econres/ifdp/files/ifdp1222r1.pdf
- International Monetary Fund (IMF), The Behavior of Currencies during Risk-off Episodes, Working Paper by Reinout De Bock and Irineu de Carvalho Filho, 11 January 2013: in risk-off episodes the Japanese yen, Swiss franc and US dollar appreciate against other G-10 and emerging-market currencies. https://www.imf.org/en/Publications/WP/Issues/2016/12/31/The-Behavior-of-Currencies-during-Risk-off-Episodes-40233
- Bank of England, Financial Stability Report, 5 July 2016: between 23 June and 1 July 2016 the sterling exchange rate index fell by 9% and short-term sterling volatility against the dollar rose to its highest in the post-Bretton Woods era; the moves reflected higher risk premia on UK assets. https://www.bankofengland.co.uk/financial-stability-report/2016/july-2016
- Bank of England, Statement from the Governor of the Bank of England following the EU referendum result, 24 June 2016: the UK voted to leave the EU; the Bank stood ready to provide more than £250bn of additional funds; some market volatility could be expected. https://www.bankofengland.co.uk/news/2016/june/statement-from-the-governor-of-the-boe-following-the-eu-referendum-result
- Bank of England, Mark Carney, Uncertainty, the economy and policy, 30 June 2016: geopolitical, economic and policy uncertainty as three distinct types of uncertainty. https://www.bankofengland.co.uk/speech/2016/uncertainty-the-economy-and-policy
- European Central Bank, Euro foreign exchange reference rates, US dollar and pound sterling (EXR.D.USD.EUR.SP00.A, EXR.D.GBP.EUR.SP00.A), April to September 2016: derived GBP/USD 1.4869 on 23 June, 1.3704 on 24 June (−7.8%), 1.2977 on 6 July (−12.7%) and 1.2962 on 30 September 2016. https://data-api.ecb.europa.eu/service/data/EXR/D.USD+GBP.EUR.SP00.A?startPeriod=2016-04-01&endPeriod=2016-09-30&format=csvdata
- European Securities and Markets Authority (ESMA), ESMA agrees to prohibit binary options and restrict CFDs to protect retail investors, 27 March 2018: negative balance protection on a per-account basis for retail CFD clients in the EU. https://www.esma.europa.eu/press-news/esma-news/esma-agrees-prohibit-binary-options-and-restrict-cfds-protect-retail-investors
Practise what you learned
Open an account to use MetaTrader 5. Start on a demo account before risking real money.
Open Account