
Commodity Currencies AUD, CAD and NZD: How the Link Works
Commodity currencies are the currencies of big raw-material exporters, such as the AUD (iron ore, coal, LNG), CAD (crude oil) and NZD (dairy). Their link to commodity prices runs through the terms of trade, and its strength shifts over time, so skilled traders measure it with rolling correlations.
Module 12 · Lesson 4 of 5
What you'll learn
- What makes the AUD, CAD and NZD commodity currencies, and how emerging-market currencies compare.
- How the terms of trade link export prices to a currency.
- Why the link drifts and breaks.
- How to measure the link and what a weaker link does to a combined position.
What are commodity currencies?
A commodity currency is the currency of an economy whose export earnings lean heavily on raw materials, so it tends to move with their prices. The usual three are the Australian dollar (AUD: iron ore, coal and liquefied natural gas, or LNG), the Canadian dollar (CAD: crude oil) and the New Zealand dollar (NZD: dairy).
The Norwegian krone (NOK: oil and gas) is often added. The main pairs are AUDUSD, USDCAD and NZDUSD; crosses such as AUDCAD and AUDNZD set two commodity currencies against each other. The US dollar moves them all too, as the US Dollar Index lesson explains.
Key terms
- Terms of trade: the ratio of a country's export prices to its import prices.
- Rolling correlation: the same number recalculated over a moving window, such as the last 60 days.
- Correlation drift: a correlation that changes in strength, or even sign, between windows.
Why do commodity prices move AUD, CAD and NZD?
Commodity prices move these currencies mainly through the terms of trade: when export prices rise against import prices, the country earns more foreign currency, and that is usually associated with a stronger currency. The Reserve Bank of Australia (RBA) writes that an increase in commodity prices typically lifts the terms of trade, which is associated with a stronger Australian dollar.
The RBA links past rises in iron ore prices and Australia's terms of trade to strong Chinese demand for steel. It also found the link is tighter when price changes look persistent, meaning long-lasting. Temporary moves, such as a supply disruption, are less likely to move the exchange rate. Some oil exporters manage or peg their currencies instead, which is how the Kuwaiti dinar became the world’s highest-valued currency.
Which commodities drive each commodity currency?
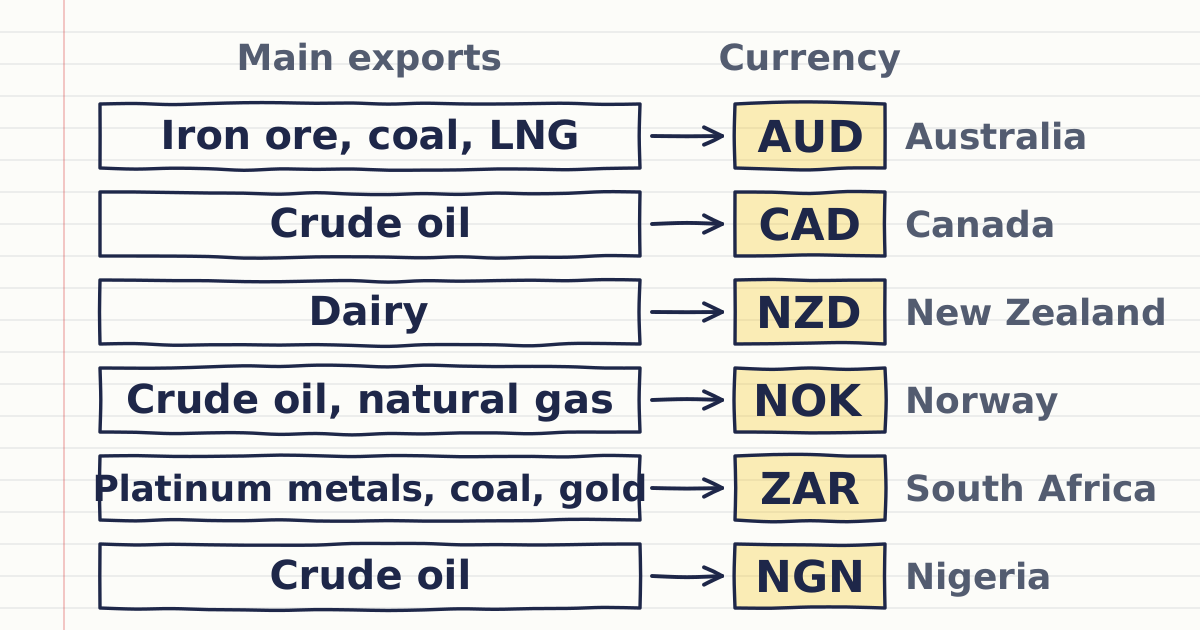
Each commodity currency is tied to a different export basket: iron ore, coal and LNG for Australia, crude oil for Canada, dairy for New Zealand, oil and gas for Norway, metals and coal for South Africa, and crude oil for Nigeria. Figures come from each country's official bodies.
| Currency | Key commodity exports | What the official figure shows |
|---|---|---|
| AUD | Iron ore, coal, LNG | Weights in the RBA's index of commodity prices from 1 April 2026, based on export values: iron ore 30.9%, LNG 16.3%, metallurgical coal 11.4%, thermal coal 8.5% |
| CAD | Crude oil | Canada's crude oil exports were C$140.0 billion in 2025, 90.1% of it to the US, out of C$778.8 billion of goods exports (about 18%) |
| NZD | Dairy | Milk powder, butter and cheese exports were NZ$24.3 billion in the year to December 2025, 30% of annual exports |
| NOK | Crude oil, natural gas | Crude oil and natural gas were NOK 1,006.7 billion of NOK 1,778.8 billion of goods exports in 2025, about 57% |
| ZAR | Platinum group metals, coal, gold, iron ore | The South African Reserve Bank's commodity index names coal, gold and platinum among its heavily weighted exports |
| NGN | Crude oil | Crude oil was 68.87% of Nigeria's total exports in the fourth quarter of 2024 |
These shares move: New Zealand's dairy exports rose 21% in a single year, mainly on higher prices.
Are emerging-market currencies commodity currencies?
Some emerging-market currencies, such as the South African rand and the Nigerian naira, belong to commodity-exporting economies, but other forces drive them too, so neither follows commodity prices one for one. A South African Reserve Bank (SARB) note describes South Africa as a major commodity exporter that benefits when the prices of its export commodities rise and stay high.
It names rhodium, palladium, thermal coal and iron ore as key exports. Nigeria leans on crude oil, as the table shows, but the naira does not track oil day to day, so measure the link with the method below. The same check works for any emerging-market currency you trade.
Why does the commodity currency link drift and break?
The link drifts because a currency answers to many forces at once, and in some periods the commodity force is drowned out by interest rates, the US dollar or temporary supply news. A correlation measured in one window describes that window only.
The RBA names the interest rate differential and risk sentiment as other key drivers of the Australian dollar: in risk-off episodes, demand for safe-haven currencies such as the US dollar rises.
- Australia. The RBA measured the correlation of weekly changes between the Australian dollar and its commodity price index. It is typically positive, but from late 2017 through 2019 it declined to around zero. The RBA linked this partly to temporary iron ore supply disruptions in 2019.
- Canada. A Bank of Canada staff note found that only a small share of the Canadian dollar's 2014–15 fall could be put down to oil, even though the fall came during a sharp drop in oil prices.
So "oil fell, so the Canadian dollar fell" is often only part of the story. This is the forex pair correlation idea from Module 10, applied across markets.
How do you measure the link yourself?
You measure the link by calculating the correlation between the daily returns of the currency pair and the commodity over a rolling window, then watching how the number changes. Use returns, not raw prices: two trending prices can look correlated even when their daily moves are unrelated.
- Collect daily closing prices for the pair, such as USDCAD, and the commodity, such as a crude oil symbol, for the same dates.
- Turn each into daily returns: today's close ÷ yesterday's close − 1.
- Calculate the correlation over the last 60 days in a spreadsheet.
- Repeat for each later 60-day window and chart the results.
- Square the number to see how strong it is: r² = r × r. At −0.7, r² is 0.49, so about half of the day-to-day variation lines up. At −0.2, r² is 0.04, or 4%.
Watch the quote direction. CAD is the second currency in USDCAD, so oil and the Canadian dollar rising together shows as a negative correlation. In AUDUSD and NZDUSD the same kind of link shows as positive.
How does correlation drift change a combined position?
When correlation weakens, a position that seemed to offset another stops doing so, and your real risk becomes close to the sum of both stops. The synthetic numbers below show the same two positions, and the same oil move, in two different periods.
You are long 100 barrels on a crude oil CFD with a stop $2.00 away, so $200 is at risk. You add long 1 lot of USDCAD, expecting it to rise when oil falls. A pip on 1 lot is CAD 10, or $8.00 at an assumed USDCAD rate of 1.2500, as the Beginner lesson on lots, pips and pip value explains. Your USDCAD stop is 25 pips away: 25 × $8.00 = $200 at risk.
On one synthetic day in each period, oil falls $2.00:
| Period A | Period B | |
|---|---|---|
| Rolling 60-day correlation, USDCAD vs oil returns | −0.7 | −0.2 |
| Oil position (100 barrels × −$2.00) | −$200 | −$200 |
| USDCAD move that day | +20 pips | −10 pips |
| USDCAD position (pips × $8.00) | +$160 | −$80 |
| Combined result | −$40 | −$280 |
In Period A, the second position softened the loss. In Period B, both lost. Skilled traders plan combined risk as the sum of both stops, $200 + $200 = $400, not the $40 of a good day, because a correlation describes past days on average. Check pip values for your own lot size with the pip value calculator.
How do traders manage commodity currency positions?
Skilled traders size each position on its own stop, count linked positions as one bet and recheck the commodity link before relying on it, because rates or US dollar news can take over from commodity prices for weeks at a time. A commodity view can be right while the currency moves on those other drivers.
- Size hedging offsets as two positions. An offset that relies on correlation works only while the correlation holds, so size both positions on their own stops.
- Count stacked risk. Long oil and short USDCAD are close to one bet placed twice when the link is strong.
- Allow for volatility. Commodity prices can move far further in a day than major currency pairs.
Commodity price drivers, such as inventories and OPEC+ decisions, are covered in what moves crypto and commodity prices.
Try it on demo
On a MetaTrader 5 demo account, open daily charts of USDCAD, AUDUSD and a crude oil symbol, if your demo offers one, side by side. Mark three weeks when oil and the Canadian dollar moved together and one when they did not, and note what else happened that week. This is a journal exercise, not a trade.
This lesson is part of the Global Macro module.
Quick check
- Which export is the largest weight in the Reserve Bank of Australia's index of commodity prices from April 2026?
- When oil and the Canadian dollar rise together, the correlation you usually see on USDCAD against oil is
- A rolling correlation of −0.7 between two return series means about what share of their day-to-day variation lines up?
- You hold long oil and long USDCAD, with $200 at risk on each stop. Planned on both stops, your combined risk is
- According to the Reserve Bank of Australia, which commodity price moves are less likely to move the exchange rate?
Frequently asked questions
Why is the Australian dollar called a commodity currency?
The Australian dollar is called a commodity currency because Australia's exports lean heavily on raw materials such as iron ore, LNG and coal. Higher prices for these lift its terms of trade, usually associated with a stronger currency.
Is the Canadian dollar correlated with oil?
The Canadian dollar has tended to move with oil, because crude oil is a large share of Canada's exports, but the link varies. A Bank of Canada staff note found that only a small share of the Canadian dollar's 2014–15 fall could be put down to oil.
Does gold move the Australian dollar?
Gold has some influence: it carries a 9.8% weight in the RBA's commodity index from April 2026, below iron ore and LNG. Measure the gold link with a rolling correlation before you use it.
Is the South African rand a commodity currency?
The rand is often grouped with commodity currencies because South Africa is a major exporter of platinum group metals, coal, gold and iron ore. Interest rates, the US dollar and risk mood also move it, so its link to commodity prices varies.
Sources
- Reserve Bank of Australia (RBA), Weights for the ICP, 1 April 2026: index weights based on average export values in 2023/24 and 2024/25, including iron ore 30.9%, LNG 16.3%, metallurgical coal 11.4%, thermal coal 8.5% and gold 9.8%. https://www.rba.gov.au/statistics/frequency/commodity-prices/2026/weights-icp-20260401.html
- Reserve Bank of Australia (RBA), Determinants of the Australian Dollar Over Recent Years, Bulletin, 18 March 2021: higher commodity prices lift the terms of trade, associated with a stronger Australian dollar; the AUD–commodity price correlation declined to around zero from late 2017 through 2019; temporary supply disruptions are less likely to move the exchange rate; strong Chinese demand for steel lifted iron ore prices and the terms of trade; the interest rate differential and risk sentiment are other key drivers, with safe-haven demand for the US dollar rising in risk-off episodes. https://www.rba.gov.au/publications/bulletin/2021/mar/determinants-of-the-australian-dollar-over-recent-years.html
- Canada Energy Regulator (CER), Market Snapshot: Overview of 2025 Canada-U.S. Energy Trade, 27 May 2026: Canada's crude oil exports were C$140.0 billion in 2025, 90.1% to the US; total goods exports were C$778.8 billion. https://www.cer-rec.gc.ca/en/data-analysis/energy-markets/market-snapshots/2026/market-snapshot-overview-of-2025-canada-us-energy-trade.html
- Bank of Canada, The Share of Systematic Variations in the Canadian Dollar—Part II, Staff Analytical Note 2017-1, February 2017: only a small share of the Canadian dollar's 2014–15 depreciation can be attributed to oil. https://www.bankofcanada.ca/2017/02/staff-analytical-note-2017-1/
- Stats NZ, New Zealand's annual exports reach $80 billion, 29 January 2026: milk powder, butter and cheese exports rose 21% to NZ$24.3 billion in the year ended December 2025, 30% of annual exports. https://www.stats.govt.nz/news/new-zealands-annual-exports-reach-80-billion/
- Statistics Norway (SSB), External trade in goods, Table 8, first revision of 2025 annual figures, page updated 15 October 2026: total goods exports NOK 1,778,791 million; crude oil NOK 435,848 million; natural gas NOK 570,881 million (together about 57%). https://www.ssb.no/en/utenriksokonomi/utenrikshandel/statistikk/utenrikshandel-med-varer
- South African Reserve Bank (SARB), Updating the SARB Index of Commodity Prices, Occasional Bulletin of Economic Notes OBEN/24/01, April 2024: South Africa is a major commodity exporter; key export commodities include rhodium, palladium, thermal coal and iron ore; coal, gold and platinum are heavily weighted in the index. https://www.resbank.co.za/content/dam/sarb/publications/occasional-bulletin-of-economic-notes/2024/updating-the-sarb-index-of-commodity-prices-april-2024-01.pdf
- National Bureau of Statistics (NBS), Nigeria, Foreign Trade in Goods Statistics, Q4 2024: crude oil exports were valued at ₦13,783.00 billion, 68.87% of total exports. https://microdata.nigerianstat.gov.ng/index.php/catalog/84
Practise what you learned
Open an account to use MetaTrader 5. Start on a demo account before risking real money.
Open Account