
How to Review Your Trades Weekly and Monthly: A Checklist
To review your trades, check each one against your written rules before you look at profit or loss, once a week, and then use a monthly review to ask whether your plan and your numbers still agree. The weekly review is for behaviour and ends in one change, and the monthly review is for the plan.
Module 15 · Lesson 3 of 4
What you'll learn
- A weekly and a monthly checklist for reviewing your trades, with a table of what to check at each.
- How to grade each trade on the decision before the result, and how to sort mistakes into three kinds.
- A review of a synthetic week of eight demo trades, with every number worked out.
- Why a few weeks of results say little, and what the monthly review is for.
This lesson is part of the Business of Trading module.
What is a trade review?
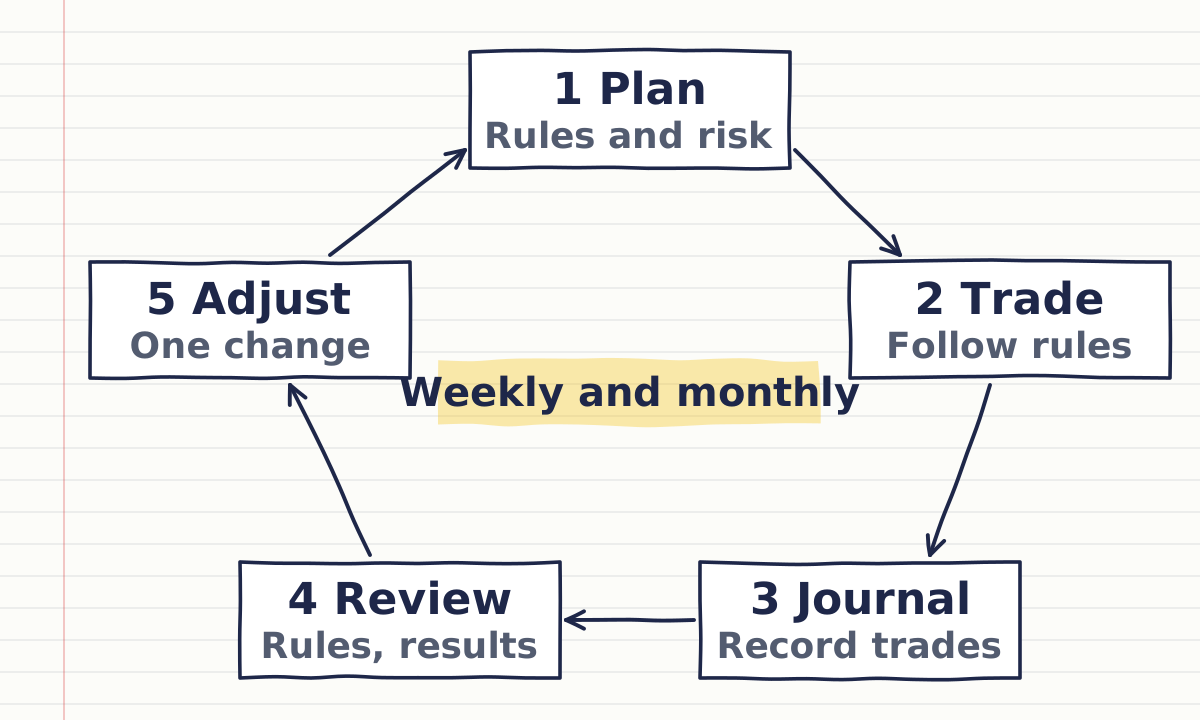
A trade review is a scheduled look back at your own trades, in which you grade each decision against your written rules before you look at the result, and then decide on one change. It runs on a calendar, not on a feeling. A weekly review catches habits, and a monthly review checks the plan.
The trading journal holds the raw record, one row per trade. The review is what you do with that record at a fixed time, away from live charts.
Definitions
- Rule check: a yes or no answer to "Did this trade follow my written rules?", as set out in the trading rules lesson.
- R and R-multiple: R is the money you lose if the stop loss is hit, and an R-multiple is a trade's result divided by that planned R. Risk $20 and gain $48, and the trade is +2.4R.
- Rule-followed rate: trades that followed every rule, divided by all trades, as a percentage.
- Error kinds: analysis (the read was wrong), execution (the read was right, the order was not) and discipline (you knew the rule and broke it).
Why review your trades on a schedule?
You review on a schedule because people judge a decision by how it turned out, and a fixed order of questions is a simple way to stop that. Psychologists call this outcome bias. A 2023 pre-registered replication of a 1988 experiment found identical decisions rated better when they ended well, according to Aiyer and colleagues (2023).
The experiment used medical scenarios; the trading habit it supports is to grade the decision first.
A scheduled review shows you what you actually did, so the next change rests on evidence, not on how the week felt.
How do you review your trades every week?
To review your trades every week, set a fixed time, open your journal, mark each trade Followed or Broke before you read its result, count the errors by kind, read the numbers, and choose exactly one change. Do it after the week closes, not during live trading. The order matters more than the length.
- Check the record is complete. Every trade has its reason, risk and screenshots. A missing entry is itself a finding.
- Grade the rules first. Cover the result column and mark each trade Followed or Broke.
- Sort each break. Label it analysis, execution or discipline (table below).
- Read the results. Net result in money and in R, win rate, average win and average loss, and the rule-followed rate. The trading expectancy calculator turns the win rate and average win and loss into an average per trade.
- Compare the two columns. Look at the result of the rule-following trades on their own, then the broken ones.
- Choose one change and write it into the plan with a date.
One change per review is deliberate. With two changes you cannot tell which one did anything.
What should you check weekly and what monthly?
Check behaviour weekly and the plan monthly, because a week is long enough to show a habit but far too short to judge a method. The table sets out the split. The statistics are defined in the trading performance metrics lesson.
| Check | Weekly review | Monthly review |
|---|---|---|
| Main question | Did I do what I wrote? | Does the plan still fit the evidence? |
| Journal complete? | Every trade has reason, risk, screenshots | Every week was reviewed and filed |
| Rule-followed rate | Count breaks and read the emotion notes | Trend across the weeks; the most-broken rule |
| Error kinds | Tally analysis, execution, discipline | Which kind repeats across weeks |
| Results | Net result in R; win rate and average win and loss as description only | Win rate, average win and loss, expectancy, profit factor and drawdown over the month |
| Risk limits | Any daily loss limit or risk-per-trade breach | Largest drawdown and longest losing run, against what the plan allows |
| Costs | Spread, commission and swap on the week | Costs as a share of gross result |
| Output | One change, dated | Keep, change or pause the plan; new plan version if changed |
How do you sort trading mistakes into three kinds?
Sort each mistake by asking one question: was the read wrong, was the order wrong, or did I know the rule and break it? The answer decides the fix, which is why a single "I made a mistake" label is not enough.
| Error kind | What it means | Where the fix goes |
|---|---|---|
| Analysis | The setup was wrong, or the written rule did not cover the situation | The strategy section of the plan |
| Execution | The read was right but the order was wrong: wrong size typed, news not checked, stop placed badly for the current volatility | The pre-trade risk checklist or the platform setup |
| Discipline | You knew the rule and broke it anyway | Close the decision in advance, as in the trading discipline lesson |
How does a weekly review read a week of trades?
A weekly review reads the rule column before the result column, so a winner that broke a rule gets flagged and a loser that followed the rules does not. Here is a synthetic week of eight trades on a $2,000 demo account, with 1R = $20 (1% of the balance).
| # | Pair | Result | R-multiple | Rule check | Error kind |
|---|---|---|---|---|---|
| 1 | EURUSD | +$36 | +1.8R | Followed | none |
| 2 | GBPUSD | −$20 | −1R | Followed | none |
| 3 | XAUUSD | +$48 | +2.4R | Broke: risked $40, not $20 | Discipline |
| 4 | USDJPY | −$20 | −1R | Followed | none |
| 5 | GBPJPY | −$20 | −1R | Broke: opened 15 minutes before a high-impact release | Execution |
| 6 | EURUSD | +$40 | +2R | Followed | none |
| 7 | AUDUSD | −$20 | −1R | Followed | none |
| 8 | NZDUSD | −$20 | −1R | Followed as written; the rule did not define "pullback" | Analysis |
Step by step:
- Net result: 36 − 20 + 48 − 20 − 20 + 40 − 20 − 20 = +$24, which is +1.2R.
- Wins: 3 of 8, a win rate of 37.5%. Average win: (36 + 48 + 40) ÷ 3 = $41.33, about 2.07R. Average loss: $20, or 1R.
- Rule breaks: 2 of 8, so the rule-followed rate is 6 ÷ 8 = 75%.
- The six trades that followed the rules netted 36 − 20 − 20 + 40 − 20 − 20 = −$4 (−0.2R).
- The two trades that broke rules netted 48 − 20 = +$28.
Read in that order, the week tells a different story from its +$24. All of the profit came from the two rule-breaking trades, and the biggest winner, trade 3, carried double the planned risk. Had it hit its stop, it would have lost $40 (−2R). It paid this week, which is exactly why it is likely to be repeated.
What the review does with this:
- One change, not three. The discipline error is the one to close first: the size field gets a fixed value or a calculator step before the order, so the decision is made in advance.
- Park the others. Trade 5 becomes a checklist question ("is a high-impact release due within 30 minutes?"). Trade 8 becomes a note to define "pullback" at the monthly review, once more weeks of evidence exist.
- Judge the plan monthly, not on this week. Eight trades cannot tell a method from luck.
How do you review your trades every month?
To review your trades every month, gather the weekly reviews, calculate the monthly statistics on the whole set, look for repeated patterns, and decide whether to keep, change or pause the plan. Make plan changes only here, in writing, as a new dated version. The structure of that document is in the trading plan lesson.
- Collect the weeks. List each week's rule-followed rate, error tally and the one change you chose.
- Calculate the month. Use a trading report to avoid hand arithmetic. The MetaTrader 5 trading report includes the best and worst trade, the longest runs of consecutive wins and losses, a profit factor by symbol and a drawdown graph, according to MetaQuotes. It cannot tell whether you followed your rules, so that count comes from your journal.
- Look for repeats. Which rule broke most often? Which error kind came up in several weeks? Did the weekly change work?
- Check the limits. Compare the worst drawdown with what the plan allows. If the plan was exceeded, that is a finding, whatever the result.
- Decide. Keep the plan, change one thing and date it as the next version, or pause live trading and go back to demo. Never add money to make up a bad month.
How many trades does a monthly review need?
More than most months provide: a monthly win rate from a few dozen trades has a wide margin of error. A standard binomial approximation gives a 40% win rate over 20 trades a standard error of √(0.4 × 0.6 ÷ 20) ≈ 0.11, or about 11 percentage points. Over 100 trades it is √(0.4 × 0.6 ÷ 100) ≈ 0.05, or about 5 points. So a monthly number is a description, not a verdict, and the most reliable thing a short month shows is behaviour: your rule-followed rate and your error tally.
What makes a trade review useful?
A trade review is useful when the record is complete, the reasons were written before the result, and each review changes one thing at a time. It is a quality check on your process: it shows exactly what you did, so every change to the plan rests on evidence rather than on how the week felt.
- Respect sample size: a week or a month of trades can swing on one result, so change the method only on evidence from many trades.
- Write reasons before entry: a reason written after the close tends to fit the outcome, as the journal lesson explains.
- Avoid over-fitting: a new rule added after every loss makes the plan longer and no more reliable. One change at a time stops that.
- Log every trade: the trades you would rather forget are often the ones the review needs most.
- End on a process change: a review that ends in "trade bigger to recover" is a discipline error, and the fix belongs in the plan, not the position size.
Try it on demo
On a MetaTrader 5 demo account, review your last five to ten demo trades. Cover the result column and mark each trade Followed or Broke. Label every break analysis, execution or discipline, then read the results and compare the rule-following trades with the broken ones. Write down exactly one change, with a date, and apply it only to next week's demo trades.
Quick check
- In a weekly trade review, what do you read first?
- A trade planned at $20 of risk was opened at $40 of risk and won $48. Measured against the planned $20, its R-multiple is
- You knew the rule and broke it anyway. Which kind of error is that?
- Which task belongs in the monthly review rather than the weekly one?
- A 40% win rate over 20 trades has a standard error of about 11 percentage points. So a monthly win rate is best read as
Frequently asked questions
How often should I review my trades?
Review your trades at least once a week and once a month, at fixed times. The weekly review checks that you followed your rules and ends in one change. The monthly review uses a larger set of trades to check the plan. Daily glances at results do not replace either.
What should a weekly trading review include?
A weekly trading review should include a complete journal, a Followed or Broke grade for every trade, a tally of errors by kind, the week's net result in R, and one dated change. Read the rule grades before the profit and loss so the outcome cannot colour them.
What should a monthly trading review include?
A monthly trading review should include the weekly summaries, the month's statistics, the worst drawdown against your plan's limits, the rule you broke most often, and a decision to keep, change or pause the plan. Any change is written as a new plan version with a date.
Should I review winning trades as well as losing ones?
Yes, review winning trades too, because a win that broke a rule will be repeated. In the worked example, the largest winner carried double the planned risk. A review that only studies losses misses the breaks that were rewarded.
How many trades do I need before my review numbers mean anything?
Several dozen trades give only a rough picture, and one week gives almost none. A 40% win rate over 20 trades has a standard error of about 11 percentage points. Use small samples to check behaviour, not to judge a method.
Sources
- Aiyer, Kam, Ng, Young, Shi and Feldman, Outcomes Affect Evaluations of Decision Quality: Replication and Extensions of Baron and Hershey's (1988) Outcome Bias Experiment 1, International Review of Social Psychology, accessed 19 October 2026: a pre-registered replication found that identical decisions were rated more favourably when they had successful outcomes than when they failed, in medical scenarios. https://doi.org/10.5334/irsp.751
- MetaQuotes, MetaTrader 5 Help: Trading Report, accessed 19 October 2026: the report includes the best and worst trade, the maximum consecutive wins and losses, a profit factor by symbol and a drawdown graph. https://www.metatrader5.com/en/terminal/help/trading/report
Practise what you learned
Open an account to use MetaTrader 5. Start on a demo account before risking real money.
Open Account