
Triangle Pattern
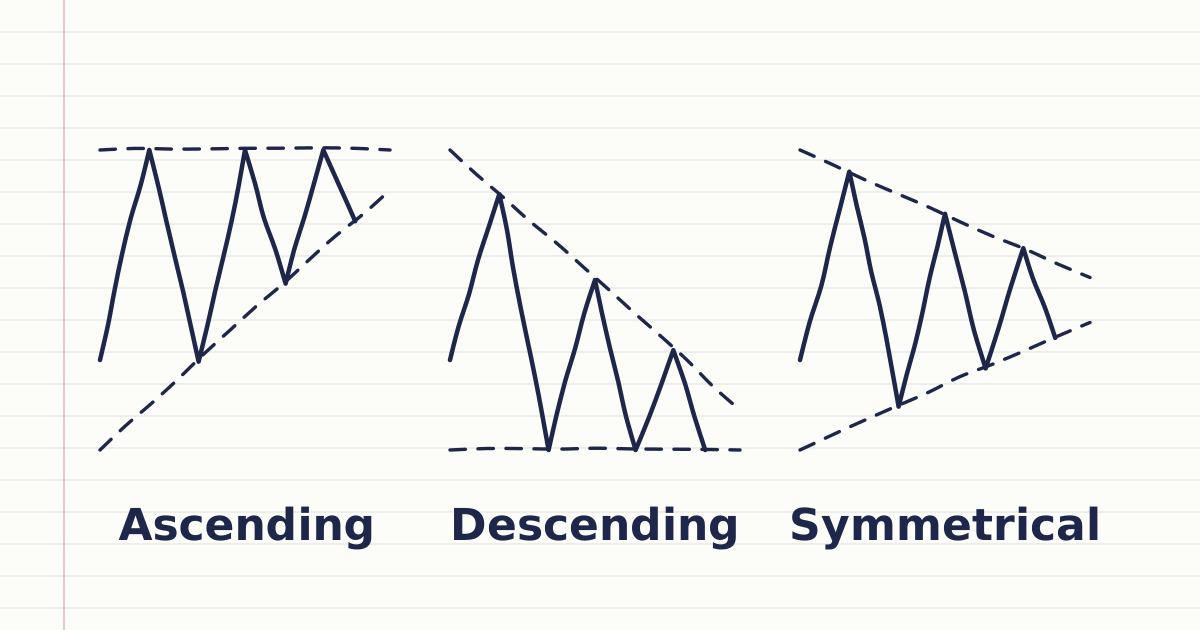
A triangle pattern is a period in which price swings narrow between two converging lines, drawn as ascending, descending or symmetrical depending on the slopes.
A triangle pattern is a stretch of trading in which price swings get smaller and smaller between two lines that converge. Chart readers name it by the slope of its lines: ascending, descending or symmetrical. Traders trade the breakout, a candle close outside one of the lines.
What are the three types of triangle pattern?
The three types of triangle pattern are ascending, with a flat top and rising lows, descending, with falling highs and a flat bottom, and symmetrical, with both lines converging. Each is named by the slope of its two lines, as the table shows; when both lines slope the same way, the shape is a wedge instead.
| Type | Upper line | Lower line | How chart readers describe it |
|---|---|---|---|
| Ascending | Flat | Rising | Buyers pressing on a ceiling |
| Descending | Falling | Flat | Sellers pressing on a floor |
| Symmetrical | Falling | Rising | Undecided; can break either way |
A flat line in a triangle is a support or resistance level: an area where new buying or selling has appeared before. A very small symmetrical triangle right after a sharp move is usually called a pennant.
Worked example: triangle pattern on EURUSD
EURUSD reaches 1.1000 three times and falls back each time, while each pullback stops higher: 1.0920, then 1.0945, then 1.0970. A candle then closes at 1.1006.
| Step | Calculation | Result |
|---|---|---|
| Flat upper line | Three highs | 1.1000 |
| Widest part | 1.1000 − 1.0920 | 80 pips |
| Breakout close | Above the upper line | 1.1006 |
| Conventional measured move | 1.1000 + 0.0080 | 1.1080 |
The measured move is taken from the triangle's widest part, and traders use it as a profit target. At 0.10 lot of EURUSD, about $1 per pip, a buy at the 1.1006 close gains about $74 if price reaches 1.1080; with the stop below the last pullback at 1.0970, a fall to the stop loses about $36.
What confirms a triangle breakout?
A triangle breakout is confirmed by a candle close outside one of the lines, ideally well before the apex and with candles widening again. Lines drawn through at least two touch points each make the read more reliable. The four checks are below.
- A candle close outside the line. A wick through it does not count.
- A break before the apex. Near the apex the lines are so close that small moves cross them, so traders favour earlier breaks; see breakouts and fakeouts.
- Well-touched lines. Draw each side through at least two touch points, and mark the flat side on the same highs or lows every time.
- Expanding range. A triangle shows falling volatility; on a real break the candles widen again.
How do you draw a triangle in MetaTrader 5?
In MetaTrader 5 you draw a triangle with a trend line through two or more touch points on each side, or a horizontal line for a flat side. Both are line objects, and all analytical objects are added from the Insert menu or the Line Studies toolbar.
What do traders often get wrong about triangles?
The common mistake is letting the triangle's type decide the trade, when traders take the trade on the close outside a line in whichever direction it comes. An ascending triangle leans bullish by convention. The chart continuation patterns lesson shows each type with its breakout.
Sources
- MetaQuotes, MetaTrader 5 Help: Lines, accessed 19 October 2026: a trend line is drawn through two points; a horizontal line marks a price level. https://www.metatrader5.com/en/terminal/help/objects/lines
- MetaQuotes, MetaTrader 5 Help: Analytical Objects, accessed 19 October 2026: objects are added from the Insert menu or the Line Studies toolbar and plotted manually. https://www.metatrader5.com/en/terminal/help/charts_analysis/objects
- Commodity Futures Trading Commission (CFTC), CFTC Glossary, accessed 19 October 2026: support and resistance as price areas of new buying and selling. https://www.cftc.gov/LearnAndProtect/AdvisoriesAndArticles/CFTCGlossary/index.htm
Practise what you learned
Open an account to use MetaTrader 5. Start on a demo account before risking real money.
Open Account