
Pennant Pattern
A pennant pattern is a short pause after a sharp price move in which the highs fall and the lows rise, forming a small triangle at the end of a pole.
A pennant pattern is a short pause after a sharp price move, in which the highs step down and the lows step up so that the pause forms a small triangle. The sharp move before it is called the pole. Traders class it as a continuation pattern.
They look for the pole's move to resume once a candle closes outside the triangle in the pole's direction.
How is a pennant different from a flag or a triangle?
A pennant has converging boundary lines after a sharp pole, a flag has parallel lines after a pole, and a symmetrical triangle converges without needing a pole. A pennant is also short, while a triangle often runs longer; a wedge converges too, but with both lines sloping the same way. The table compares the three shapes.
| Shape | Boundary lines | Comes after | Typical length |
|---|---|---|---|
| Pennant | Converging | A sharp pole | Short |
| Bull flag or bear flag | Parallel, sloping against the pole | A sharp pole | Short |
| Symmetrical triangle | Converging | Any trend or range; no pole needed | Often longer |
So a pennant is, in effect, a small symmetrical triangle that follows a pole. The chart continuation patterns lesson compares all of them side by side.
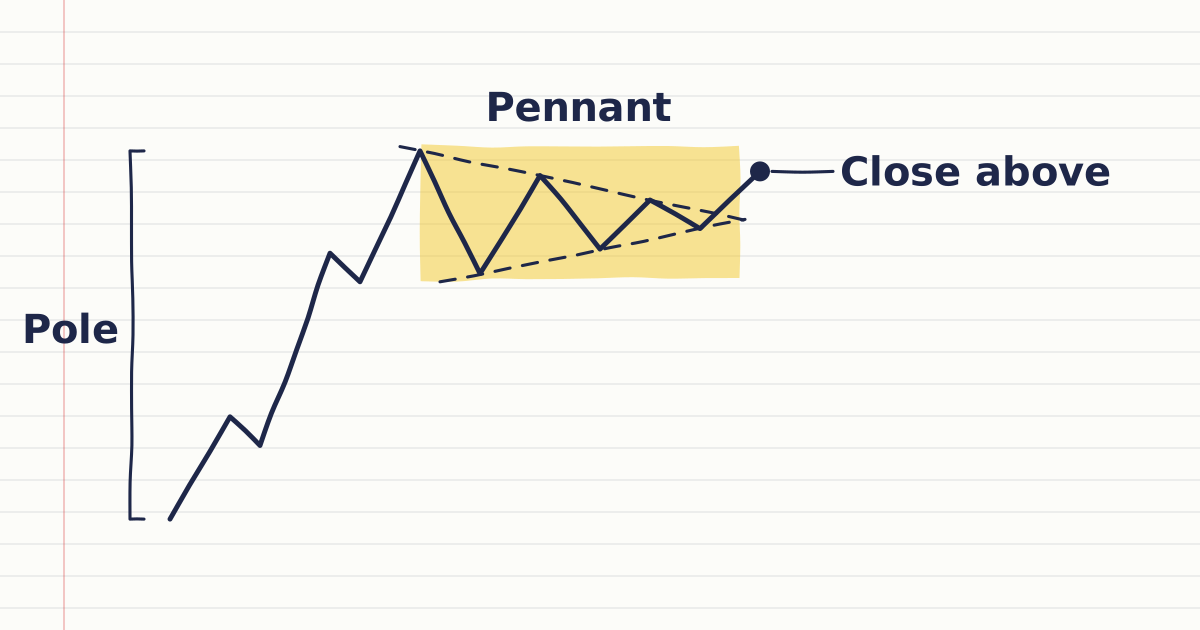
Worked example: pennant pattern on GBPUSD
GBPUSD rises from 1.2600 to 1.2690, a 90-pip pole. Over the next candles the highs fall (1.2690, 1.2684, 1.2678) and the lows rise (1.2660, 1.2666, 1.2671). A candle then closes at 1.2685, above the upper line.
| Step | Calculation | Result |
|---|---|---|
| Pole height | 1.2690 − 1.2600 | 90 pips |
| Breakout close | Above the upper line | 1.2685 |
| Conventional measured move | 1.2685 + 0.0090 | 1.2775 |
Traders use the measured move as a profit target. At 0.10 lot of GBPUSD, about $1 per pip, a buy at 1.2685 gains about $90 if price reaches 1.2775; with the stop below the pennant's last low at 1.2671, a fall to the stop loses about $14.
What confirms a pennant breakout?
A pennant breakout is confirmed when a candle closes outside the triangle in the pole's direction, after a short pause of only a handful of candles. Many traders also want a retest of the broken line before they act. The three checks are below.
- A close outside the triangle, in the pole's direction. A wick through the line alone does not count.
- A short pause. A pennant forms over a handful of candles; a pause that drags on is a symmetrical triangle or consolidation.
- A retest. Some traders wait for price to come back to the broken line and turn away from it. Breakouts and fakeouts shows how a real break and a false one look.
How do you draw a pennant in MetaTrader 5?
MetaTrader 5 does not label pennants, so you draw one yourself with two trend lines: one across the falling highs and one across the rising lows. Both are trend lines from the analytical objects on the Insert menu, and the shape counts as a pennant only where they converge after a sharp pole.
What do traders often get wrong about pennants?
The common mistake is calling any small triangle a pennant, when a pennant needs a sharp pole before the converging pause. Without the pole, the same converging shape is a symmetrical triangle, and the triangle pattern page covers how that shape is read and traded.
Sources
- MetaQuotes, MetaTrader 5 Help: Lines, accessed 19 October 2026: a trend line is drawn through two points. https://www.metatrader5.com/en/terminal/help/objects/lines
- MetaQuotes, MetaTrader 5 Help: Analytical Objects, accessed 19 October 2026: objects are added from the Insert menu or the Line Studies toolbar and plotted manually. https://www.metatrader5.com/en/terminal/help/charts_analysis/objects
Practise what you learned
Open an account to use MetaTrader 5. Start on a demo account before risking real money.
Open Account