
Double Top Pattern
A double top pattern is two peaks at roughly the same price after a rise, with a dip between them, describing price failing twice at the same area.
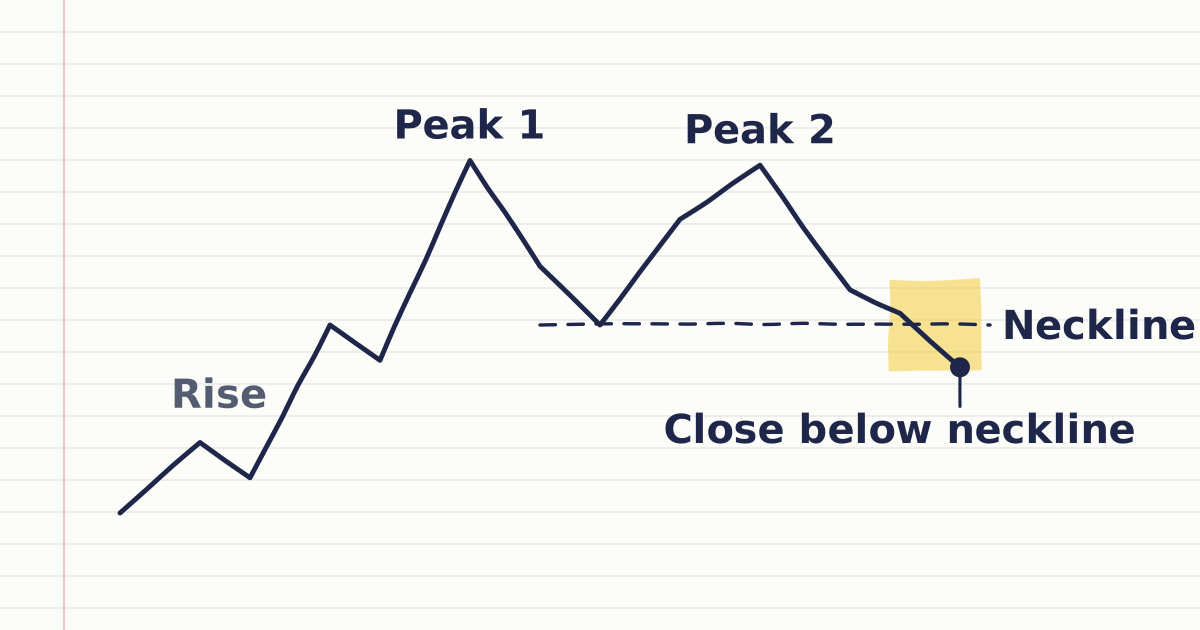
A double top pattern is two peaks at roughly the same price after a rise, with a dip between them. It describes price rising to an area twice and failing to close above it both times. The low of the dip between the peaks is called the neckline.
Chart readers treat a double top as a reversal shape, confirmed by a close below the neckline. It is a convention with no official definition.
How do you recognise a double top?
You recognise a double top by a rise, two peaks at a similar price, a dip between them, and a close below that dip's low, the neckline. Before that close the shape is just two peaks, which is also what a range looks like, so many chart readers wait for it.
- A rise first. Without an earlier rise there is nothing to reverse.
- Two peaks at a similar price. They rarely match to the pip; how close is close enough is a judgement call.
- A clear dip between them. Its low is the neckline.
- A close below the neckline. Many chart readers only call the pattern complete after this. Before it, the shape is just two peaks, which is also what a range looks like.
The mirror image, two troughs after a fall, is the double bottom. A three-peak version with a higher middle peak is the head and shoulders pattern.
Worked example: double top on EURUSD
EURUSD rises to 1.0950, dips to 1.0880, rises again to 1.0948, then falls and closes at 1.0870.
| Step | Calculation | Result |
|---|---|---|
| Peaks | 1.0950 and 1.0948 | 2 pips apart |
| Neckline | Low between the peaks | 1.0880 |
| Pattern height | 1.0950 − 1.0880 | 70 pips |
| Close below neckline | 1.0870 < 1.0880 | Pattern called complete |
| Conventional projection | 1.0880 − 0.0070 | 1.0810 |
The projection measures the pattern's size. At 0.10 lot, a pip on EURUSD is about $1, so a short position gains about $70 if price falls 70 pips and loses about $70 if it rises 70 pips.
What confirms a double top?
A candle close below the neckline confirms a double top; a later close back above the peaks cancels the pattern. Before that close, the two peaks are only a resistance area where selling has emerged twice. Traders also check the higher timeframe and size the position from a stop above the peaks.
- A close below the neckline. Before it, two peaks are a resistance area where selling has emerged twice; the neckline close completes the pattern.
- The higher timeframe. A double top on M15 can be a small wiggle inside an H4 uptrend, so check the larger chart.
- A stop above the peaks. A close back above the peaks cancels the pattern, so traders size the position from that stop-loss distance.
How do you draw a double top in MetaTrader 5?
MetaTrader 5 has no built-in double top detector, so you mark the two peaks and the neckline yourself with horizontal lines. Add the horizontal lines from the Insert menu, and open the Data Window with Ctrl+D to read each candle's exact high and close.
Does a double top mean the uptrend is over?
No: a double top describes two turns lower at one price, and the pattern only completes when a candle closes below the neckline. Until that close, the chart simply shows two peaks in an uptrend, and price can still push on to new highs.
Sources
- Commodity Futures Trading Commission (CFTC), CFTC Glossary, accessed 19 October 2026: resistance as a price area where new selling emerges. https://www.cftc.gov/LearnAndProtect/AdvisoriesAndArticles/CFTCGlossary/index.htm
- MetaQuotes, MetaTrader 5 Help: Lines, accessed 19 October 2026: a horizontal line marks a price level such as support or resistance. https://www.metatrader5.com/en/terminal/help/objects/lines
- MetaQuotes, MetaTrader 5 Help: Hot Keys, accessed 19 October 2026: Ctrl+D opens the Data Window. https://www.metatrader5.com/en/terminal/help/start_advanced/hotkeys
Practise what you learned
Open an account to use MetaTrader 5. Start on a demo account before risking real money.
Open Account