
Double Bottom
A double bottom is two troughs at roughly the same price after a fall, with a rally between them, describing price holding twice at the same area.
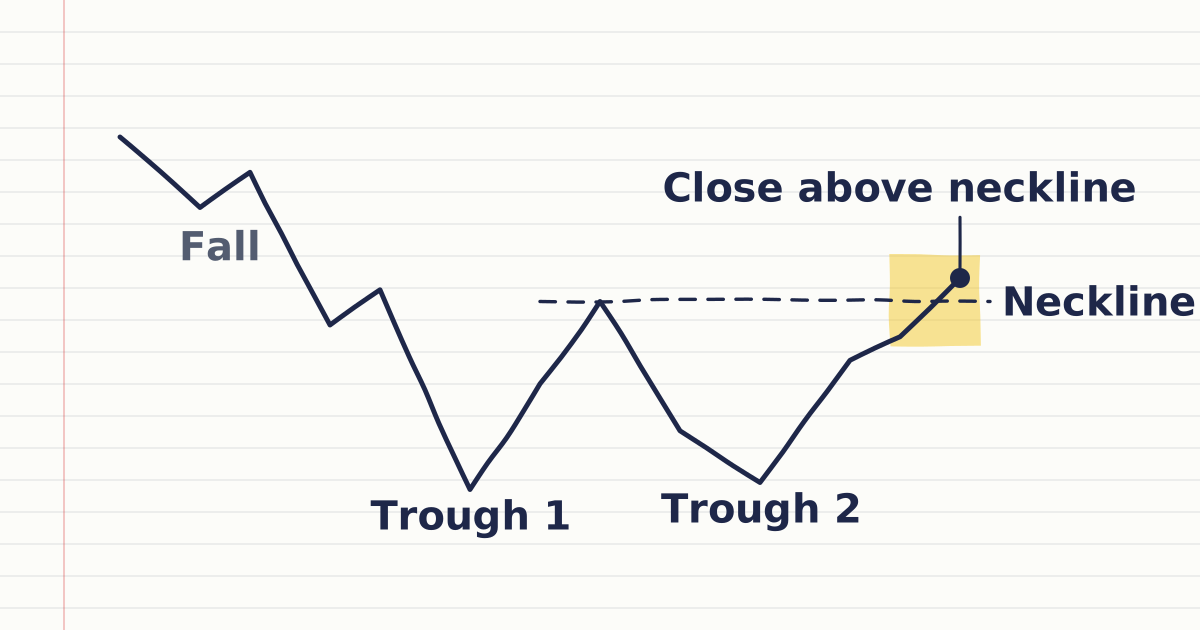
A double bottom is a chart shape made of two troughs at roughly the same price after a fall, with a rally between them. It describes price dropping to an area twice and not closing below it the second time. The high of the rally between the troughs is called the neckline.
It is the mirror image of the double top pattern, and like it, it is a chart-reading convention rather than a rule.
How do you recognise a double bottom?
You recognise a double bottom by a fall, two troughs at a similar price, a rally between them, and a close above that rally's high, the neckline. Until that close, two troughs can simply be the lower edge of a range, so many chart readers wait for it before calling the pattern complete.
- A fall first. The shape only counts as a possible reversal after a decline.
- Two troughs at a similar price. They seldom match exactly.
- A rally between them. Its high is the neckline.
- A close above the neckline. Many chart readers wait for this before calling the pattern complete. Until then, two troughs can simply be the lower edge of a range.
The three-trough version with a lower middle trough is the inverse head and shoulders pattern.
Worked example: double bottom on AUDUSD
AUDUSD falls to 0.6500, rallies to 0.6580, falls to 0.6503, then rises and closes at 0.6590.
| Step | Calculation | Result |
|---|---|---|
| Troughs | 0.6500 and 0.6503 | 3 pips apart |
| Neckline | High between the troughs | 0.6580 |
| Pattern height | 0.6580 − 0.6500 | 80 pips |
| Close above neckline | 0.6590 > 0.6580 | Pattern called complete |
| Conventional projection | 0.6580 + 0.0080 | 0.6660 |
The projection measures the size of the shape. At 0.10 lot, a pip on AUDUSD is about $1, so a long position gains about $80 if price rises 80 pips and loses about $80 if it falls 80 pips. A stop-loss and position size set that amount before entry.
What confirms a double bottom?
A candle close above the neckline confirms a double bottom; a later close back below the neckline cancels the breakout. The two troughs mark support, a price area where buying has stopped the decline twice. Chart readers apply one fixed rule for how close the troughs must be and where the neckline sits.
- A close above the neckline. That close completes the pattern; a close back below the neckline cancels the breakout.
- The troughs mark support, a price area where buying has stemmed the decline twice; see support and resistance.
- One placement rule. Decide how close the troughs must be (3 pips in the example) and where the neckline sits, then apply the same rule every time.
How do you draw a double bottom in MetaTrader 5?
MetaTrader 5 has no built-in double bottom indicator, so you draw horizontal lines at the two troughs and at the neckline yourself. Use the horizontal lines from the analytical objects on the Insert menu, and check candle closes in the Data Window to see whether a close cleared the neckline.
Does a double bottom mark the lowest price?
No: a double bottom marks two lows that have already happened, not the lowest price the market will reach. Chart readers treat a close below both troughs as cancelling the pattern, which makes that level a natural place for the stop. Size the position from that distance.
Sources
- Commodity Futures Trading Commission (CFTC), CFTC Glossary, accessed 19 October 2026: support as a price area where new buying is likely to stem a decline. https://www.cftc.gov/LearnAndProtect/AdvisoriesAndArticles/CFTCGlossary/index.htm
- MetaQuotes, MetaTrader 5 Help: Lines, accessed 19 October 2026: horizontal lines mark price levels. https://www.metatrader5.com/en/terminal/help/objects/lines
- MetaQuotes, MetaTrader 5 Help: Analytical Objects, accessed 19 October 2026: objects are added from the Insert menu or the Line Studies toolbar and plotted manually. https://www.metatrader5.com/en/terminal/help/charts_analysis/objects
Practise what you learned
Open an account to use MetaTrader 5. Start on a demo account before risking real money.
Open Account